

Bitcoin (BTC) has fallen by over 67% in 2022 and is now wobbling between a tight trading range defined by $28,000 as interim support and $30,500 as interim resistance.
The selloff appears in the wake of the Federal Reserve’s hawkish policy and the uncertainties in the crypto market led by Terra, an algorithmic stablecoin project whose native token LUNA fell by 99% earlier in the month.
Nonetheless, Bitcoin’s decline has somewhat cooled down as May draws to a close, leaving speculators with the hope that the token is in the process of bottoming out.
Something like this might play out for #Bitcoin. Notice the lower left corner we had a double bottom before getting a green wave. We’re currently sitting at the bottom of the wedge. We can go a little lower and form another double bottom before reversing. pic.twitter.com/feuzp5tiDZ
— BitcoinAlArab (@BitcoinAlArabx) May 23, 2022
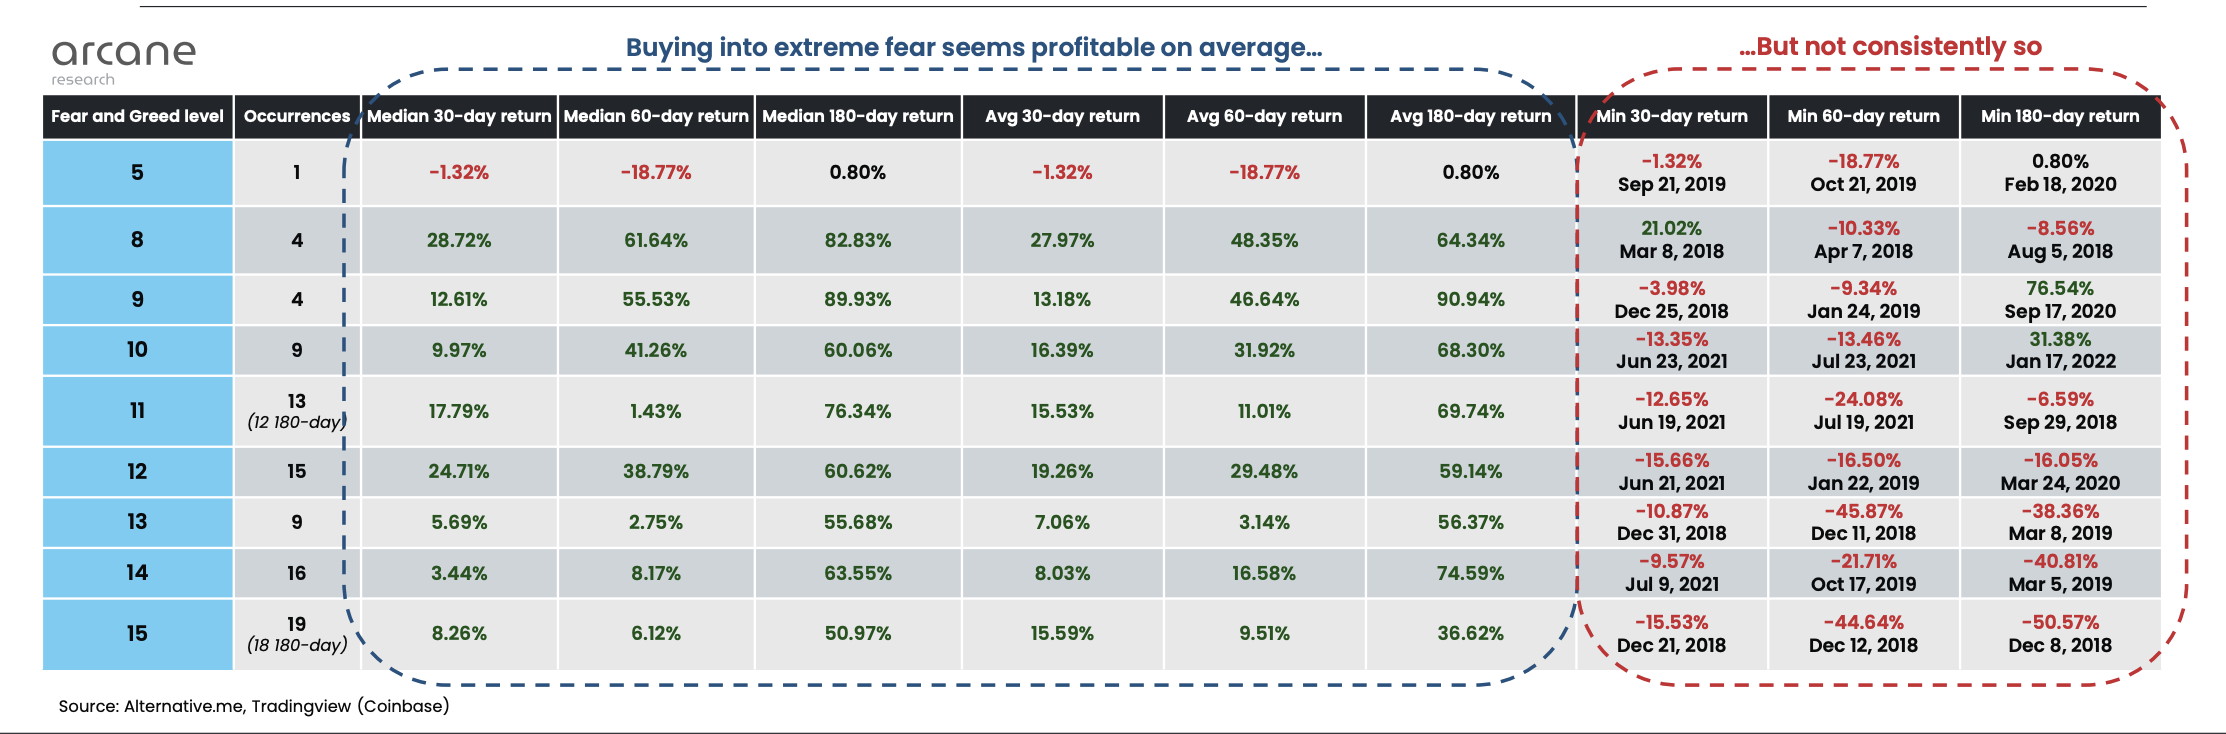
Interestingly, Bitcoin’s Fear and Greed Index (F&>) also hints at the same scenario, notes Arcane Research in its latest weekly report.
Bitcoin F&> readings hit March 2020 lows
In detail, Bitcoin’s F&> reached the score 8 on May 17, indicating “extreme fear,” a first since March 2020.
“We see that buying fear has previously been a profitable strategy when measuring median and average returns of previous extreme fear periods,” Arcane wrote while citing the four instances wherein Bitcoin’s F&> had dropped to 8.
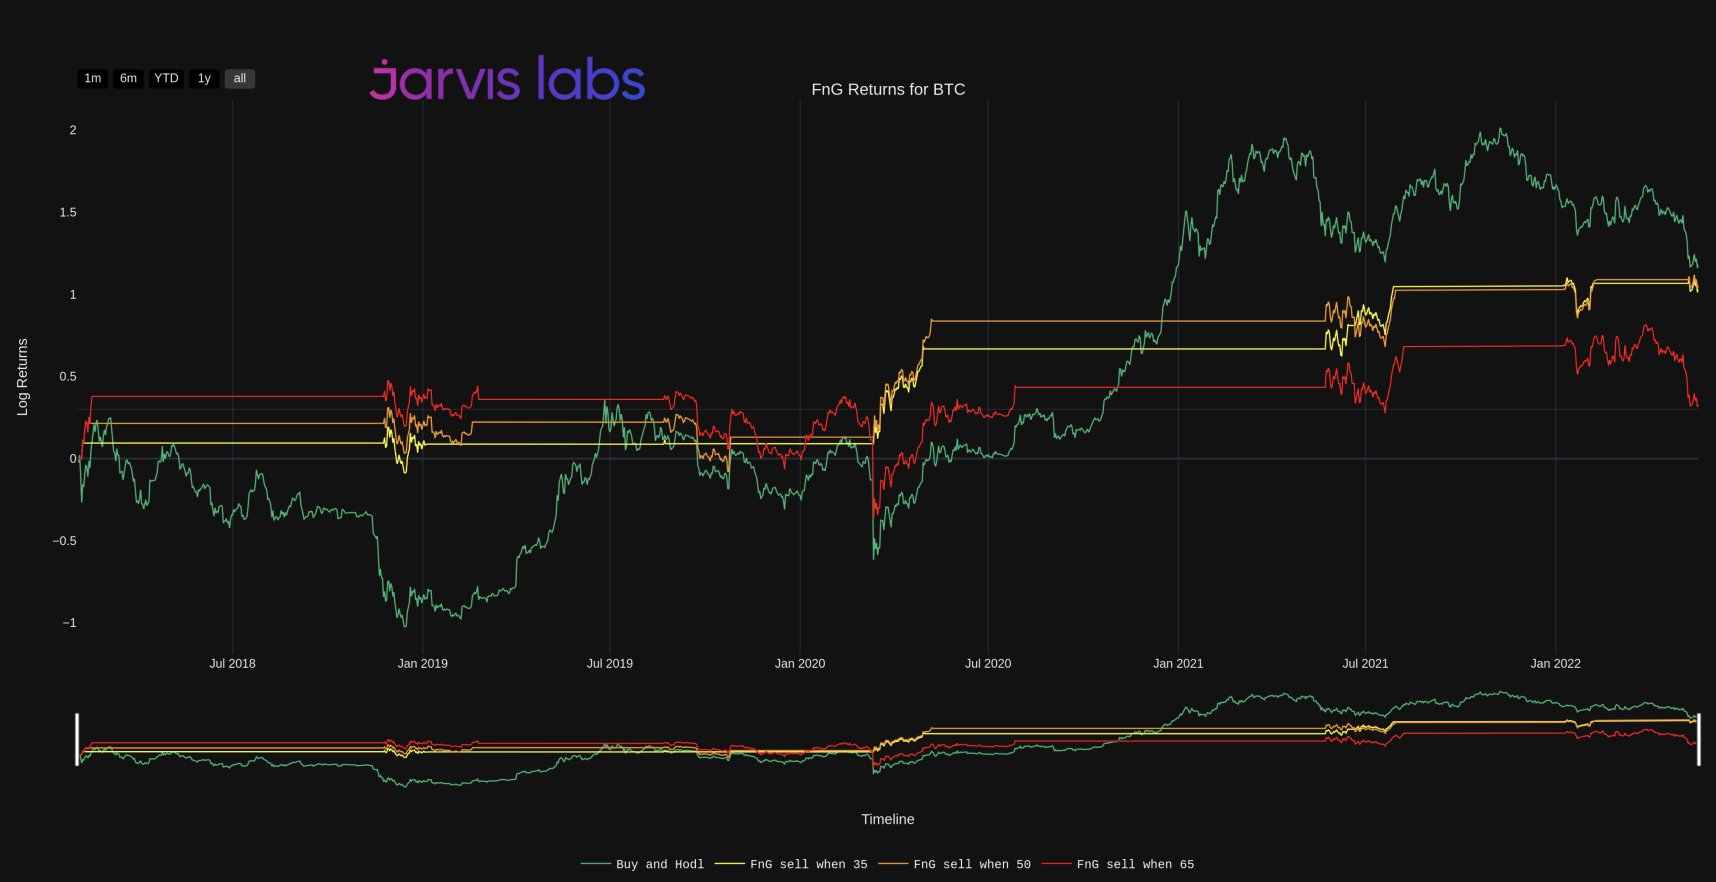
Meanwhile, Ben Lilly, market researcher at Jarvis Labs, added that Bitcoin’s F&> index falling below ten signals the extreme possibility of the market bottoming out. He also noted that buying Bitcoin when its F&> score is below 10 is a good short-term strategy, saying:
“Turns out the strategy where you hold it for less time produced greater results. Meaning the strategy where you sold after F&> rose above 35 (yellow line in the chart [below]) produced better results than a reading of 50 (orange) and 80 (red).”
On the flip side, Arcane highlighted that not all lower F&> scores have guaranteed bullish retracement moves in the past; some preceded continued selloffs. For instance, Bitcoin dropped nearly 11% on April 7, 2018, just sixty days after its F&> reached extreme fear levels.
More indicators signal bottom
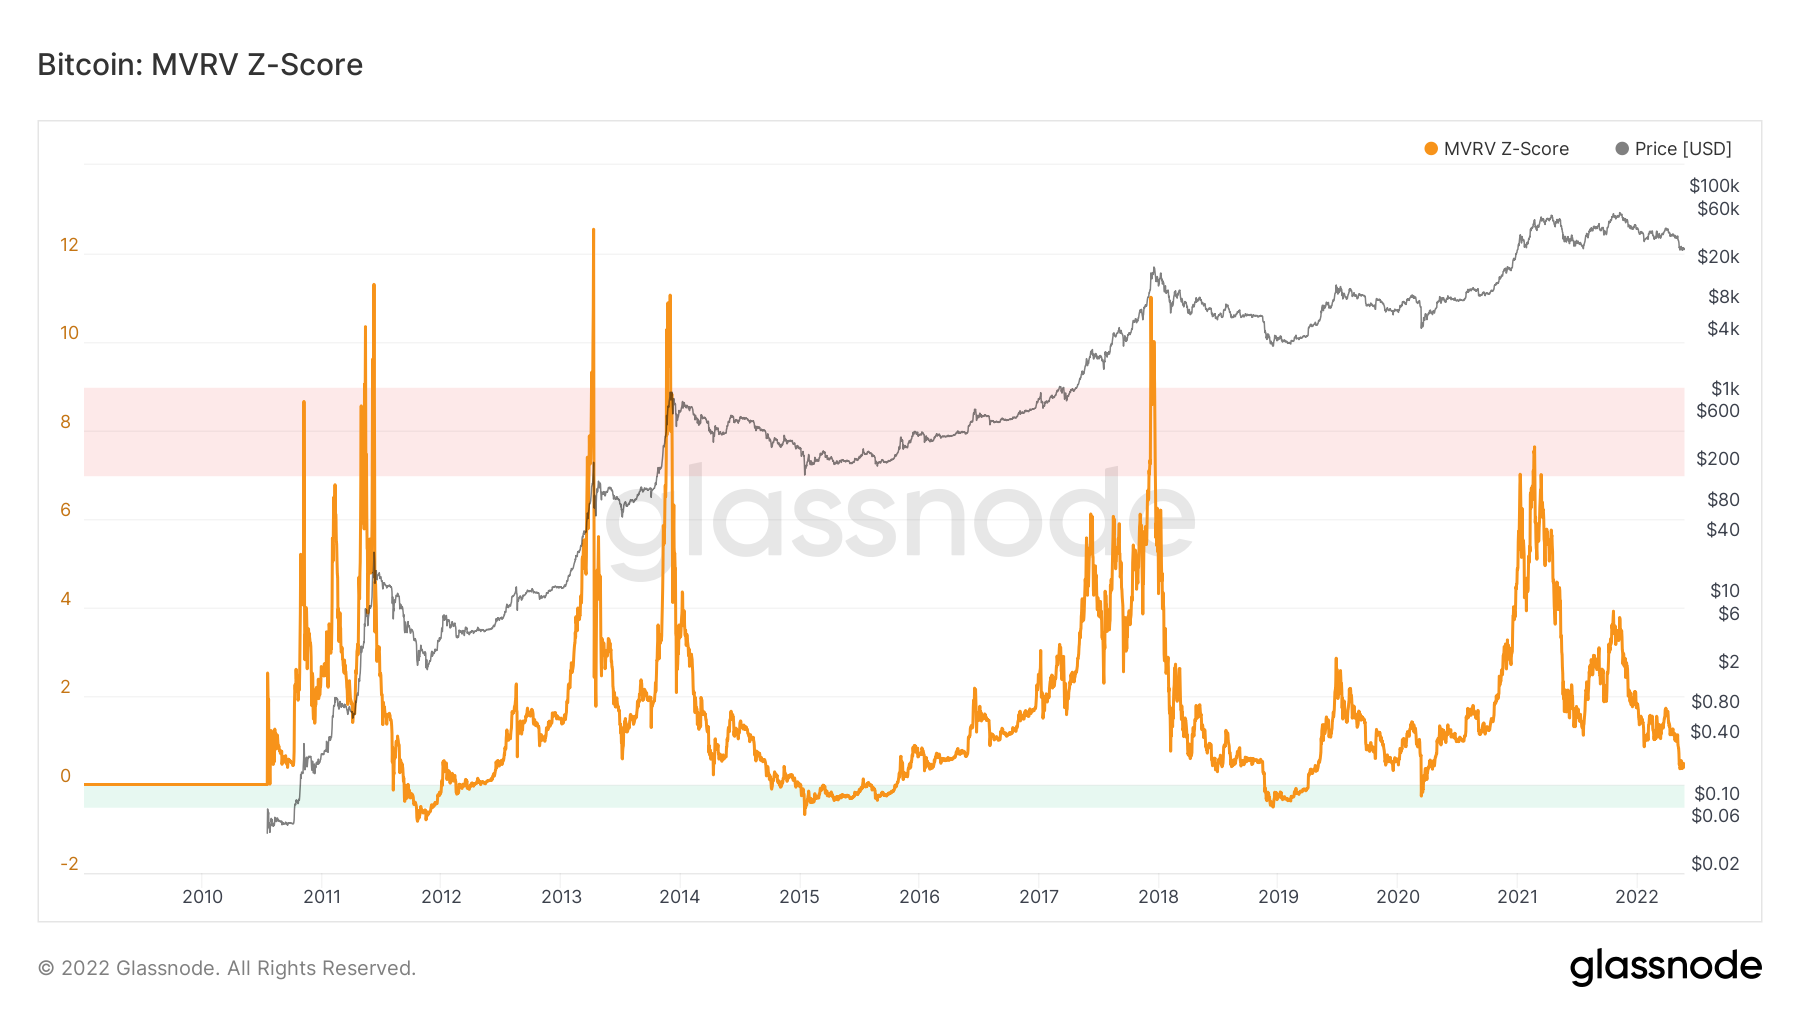
More signs of a possible in the Bitcoin market come from several on-chain indicators.
For instance, Glassnode’s MVRZ Z-Score, which assesses when Bitcoin is undervalued/overvalued based on its “fair value,” is nearing the green zone that had preceded the crypto’s massive rebound rallies, as shown in the chart below.
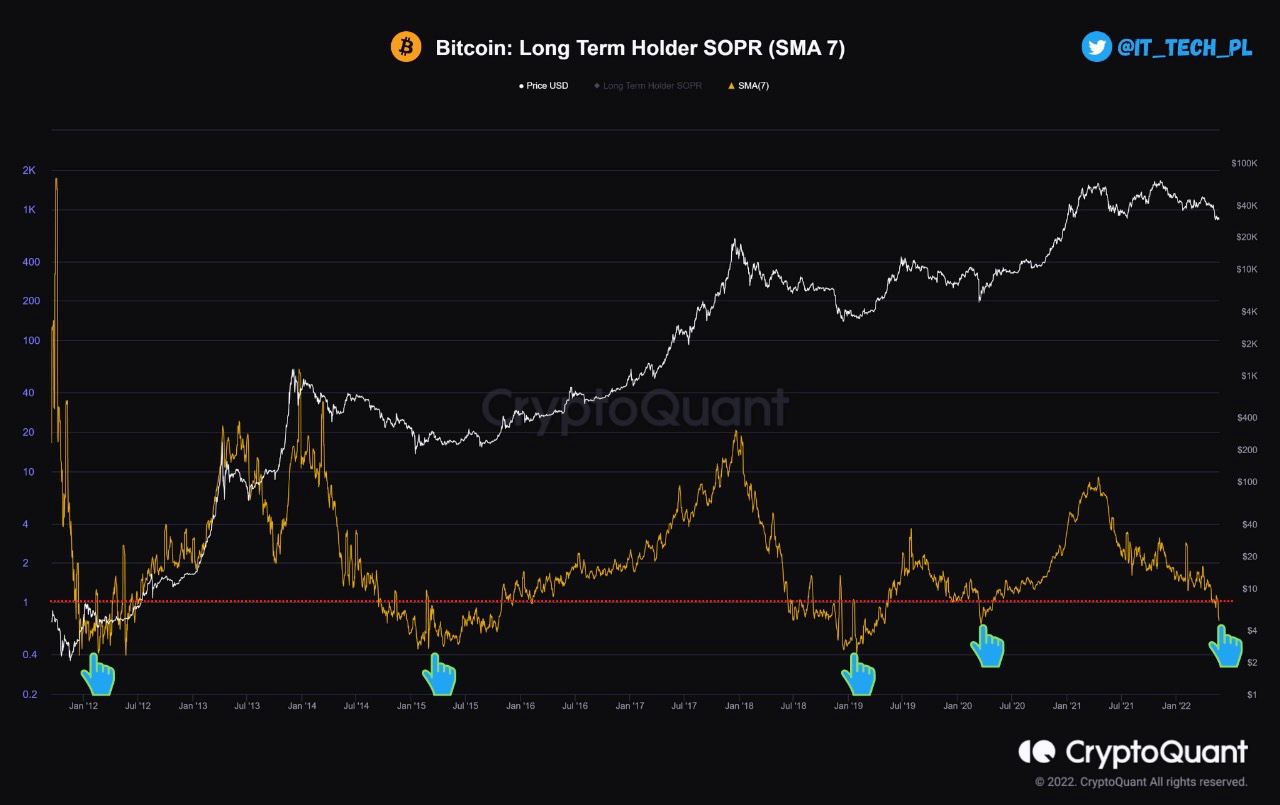
Simultaneously, the Long Term Output Profit Ratio (LTH-SOPR) indicator, which “evaluates the profit ratio of the whole market participants by comparing the value of outputs at the spent time to created time,” also suggests that Bitcoin is bottoming out.
Specifically, when the LTH-SOPR value falls below 1, it highlights that some long-term Bitcoin holders could sell BTC at a loss. Conversely, a value above 1 shows that they could sell in profit.
As of May 25, the LTH-SOPR is 0.72, which could mean a potential forming bottom in the Bitcoin market because people will be reluctant to sell BTC at a loss.
Selloff warnings remain for BTC
Nevertheless, the uplifting bottom indicators appear in contrast to a few other bearish signs elsewhere in the market and calls for as low as $15,500 and even below $10,000.
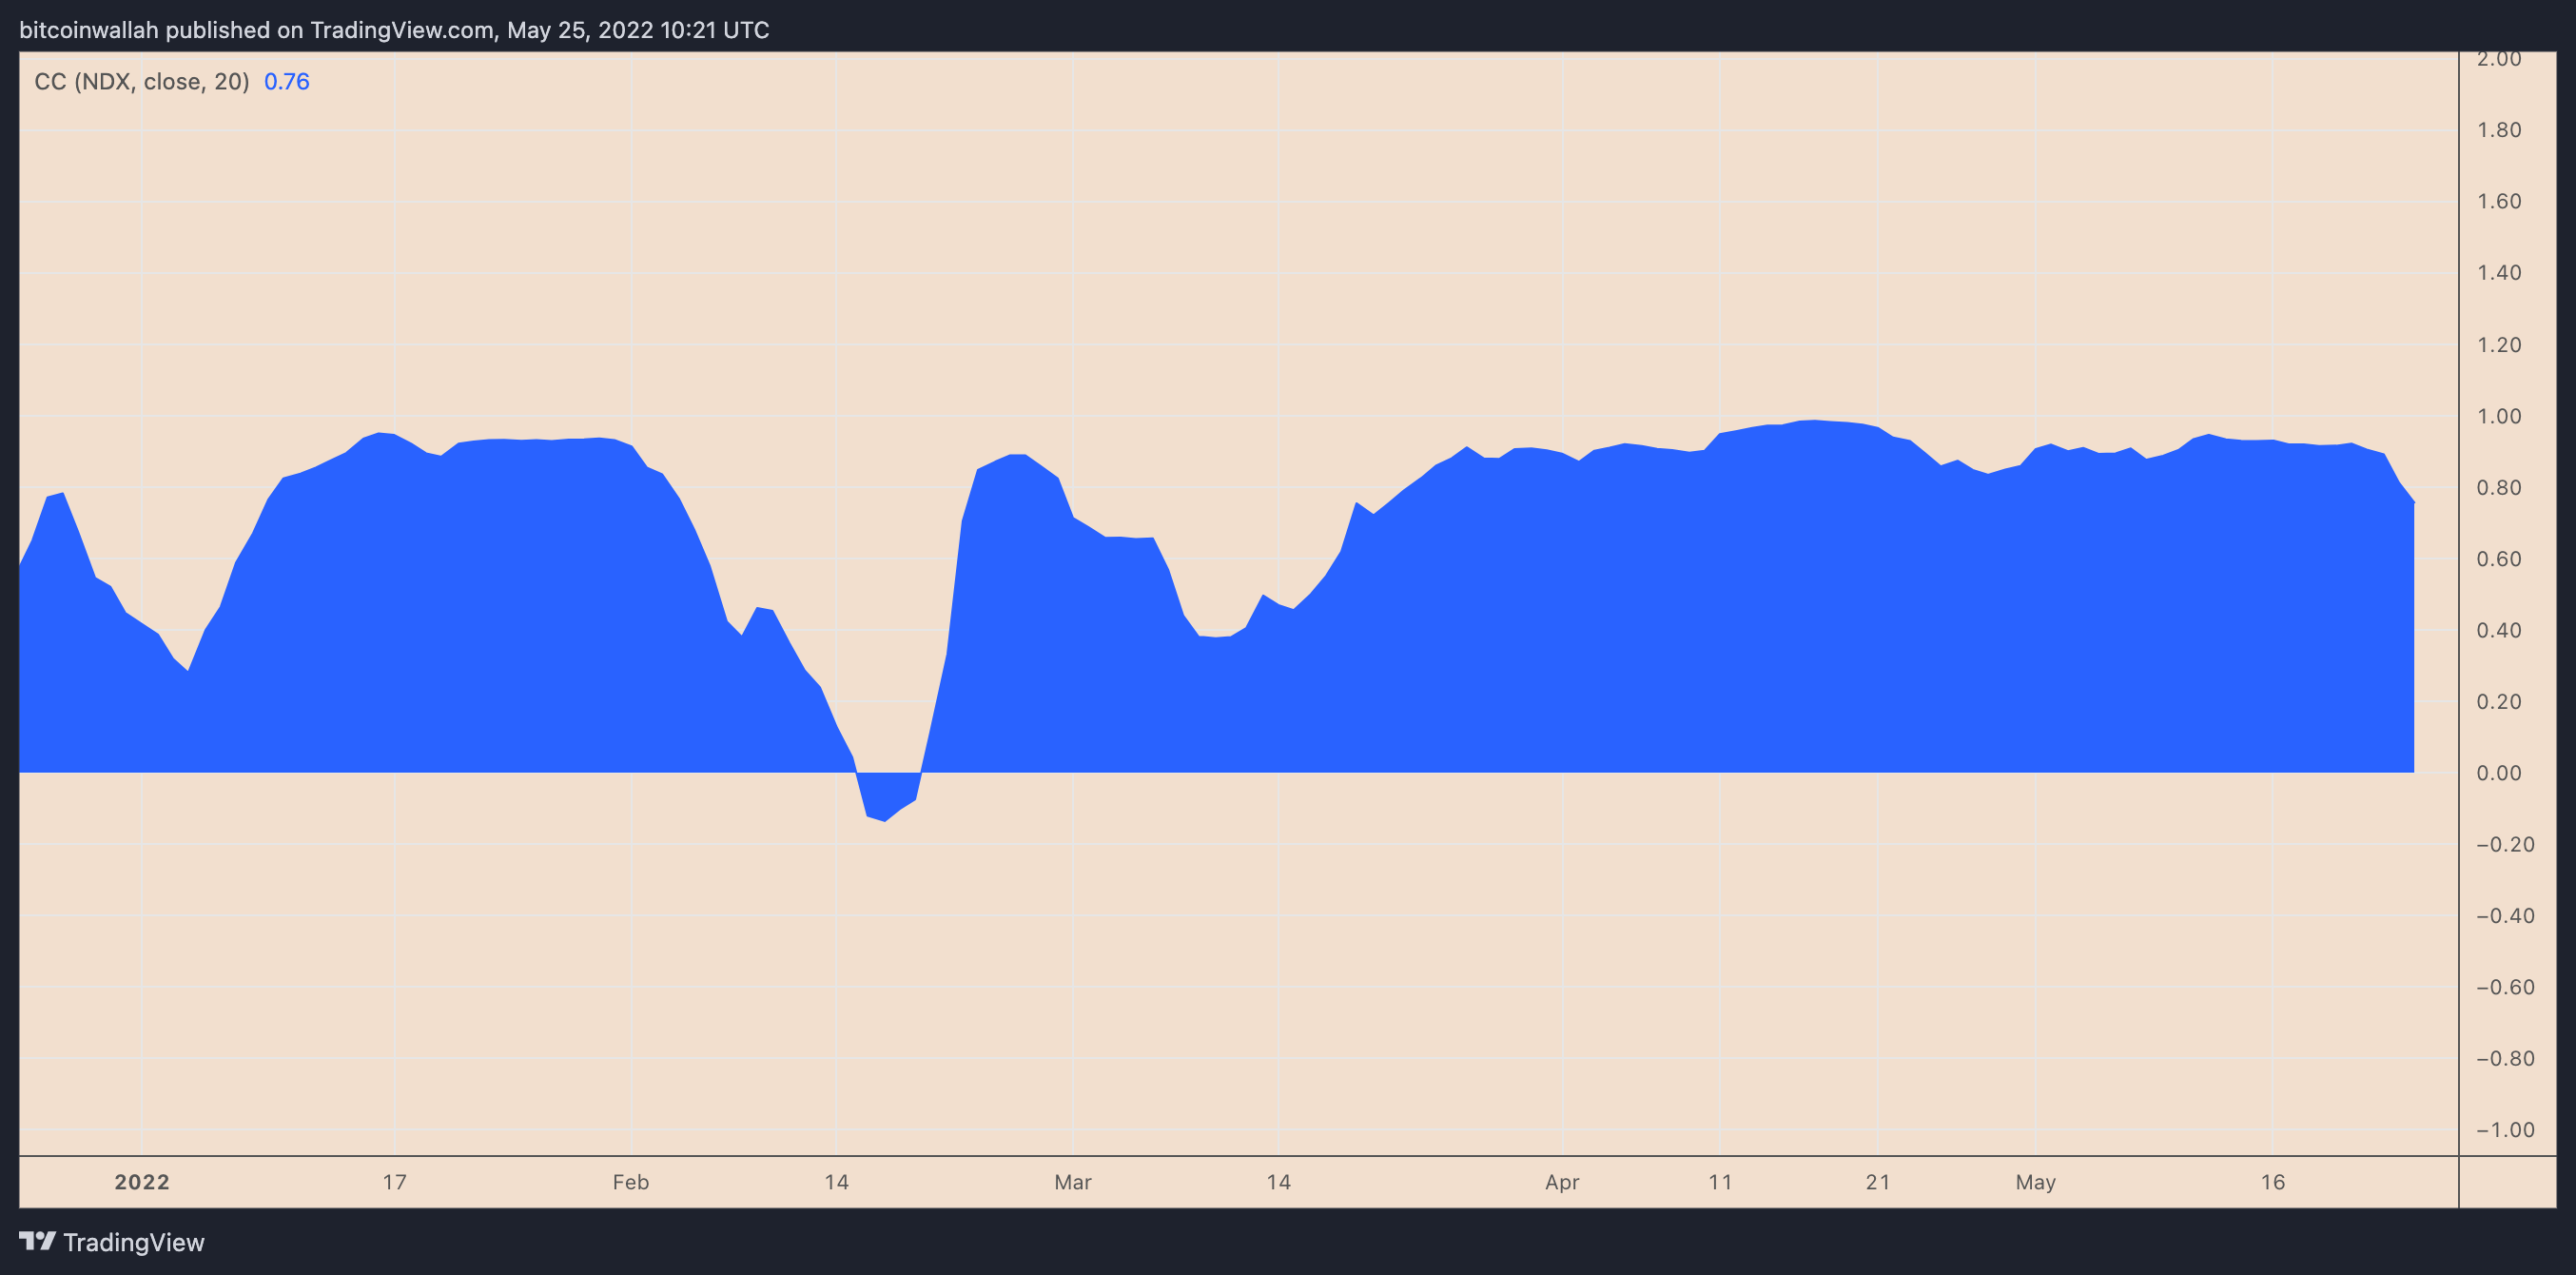
For instance, Scott Minerd, chief investment officer at Guggenheim, argues that Bitcoin is on its way to $8,000, a 70% drop from today’s price. Minerd cites a hawkish Federal Reserve for the bearish outlook on Bitcoin, whose daily correlation with Nasdaq has been positive since February 2022.
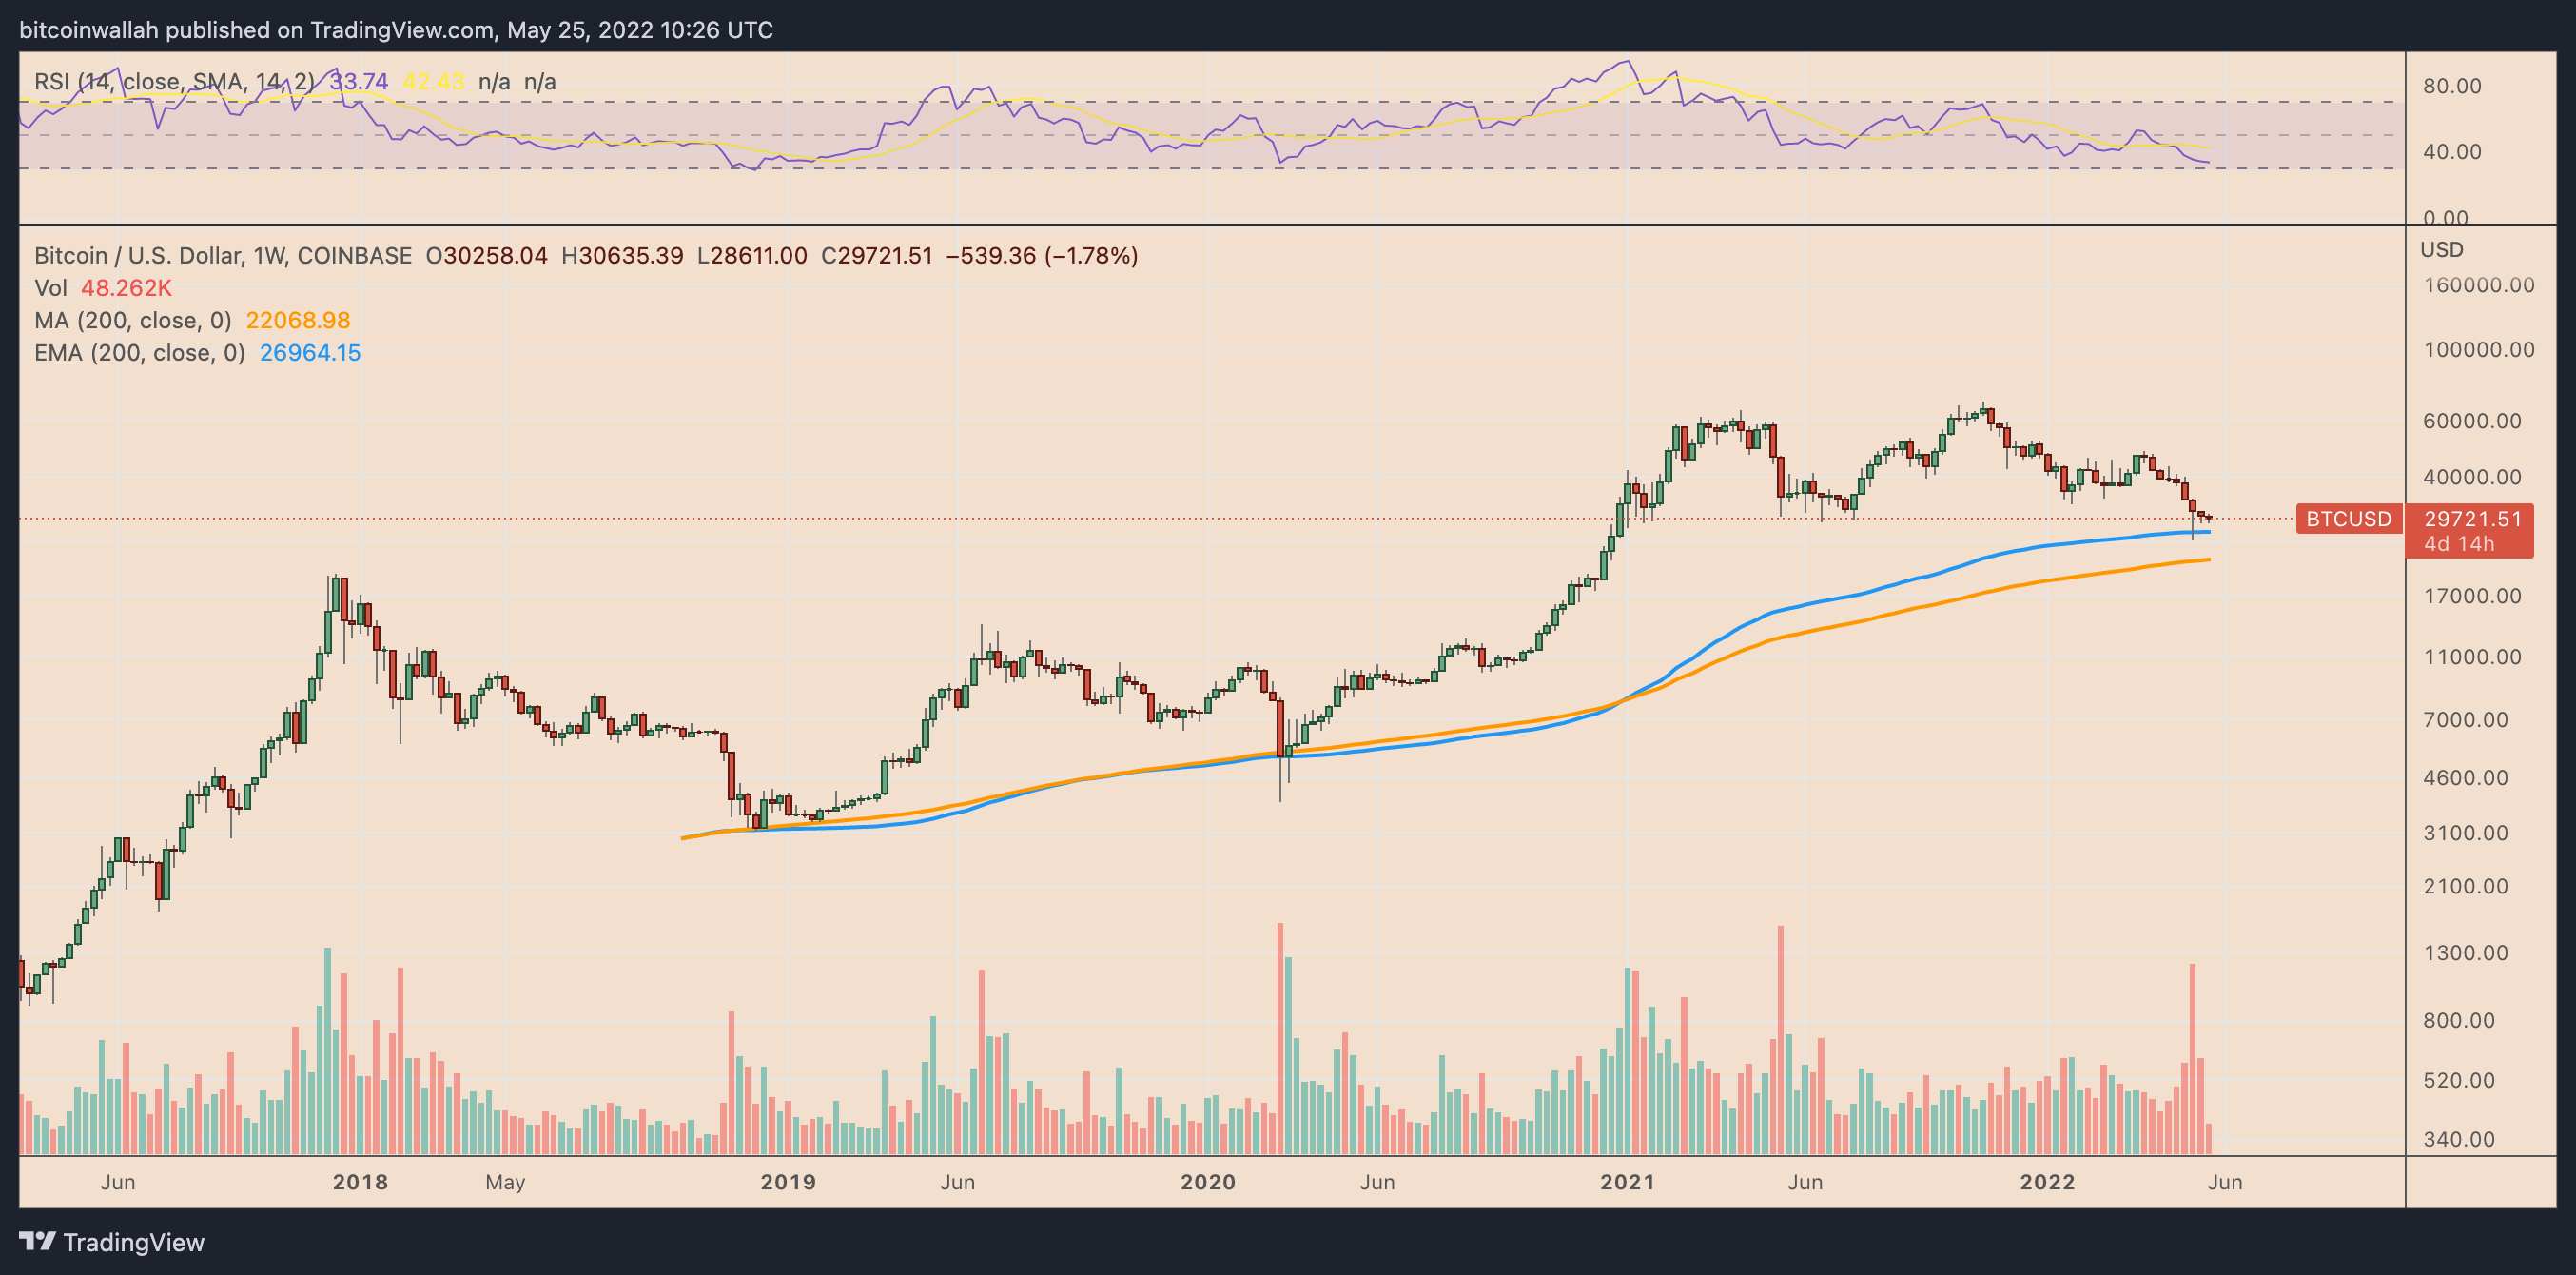
From the technical perspective, Bitcoin could indeed fall further toward the $22,000-$26,000 range before bottoming out.
Related: Bitcoin ‘death cross’ data hints 43% drop due in BTC price bear market
These levels coincide with two historical support levels—the 200-day exponential moving average (200-week EMA; the blue wave) and the 200-day simple moving average (200-week SMA; the orange wave)—that marked the end of BTC’s previous bearish cycles.
“Towards the downside, the $25,000 bottom from May 12th is the closest support level below $29,000,” further noted Arcane’s researchers Vetle Lunde and Jalan Mellerud, adding that Bitcoin’s “next critical support level” could be around $20,000, the 2017 peak. Excerpts:
“Towards the upside, $30,500 has been a strong resistance area over the last week. If BTC breaks out of resistance, $35,000 is the next key resistance area.”
The views and opinions expressed here are solely those of the author and do not necessarily reflect the views of Cointelegraph.com. Every investment and trading move involves risk, you should conduct your own research when making a decision.
|
|
Leave a Reply
You must be logged in to post a comment.