

The geopolitical tension between Russia and Ukraine has resulted in investors seeking safe-haven assets. Contrary to expectations by crypto investors, Bitcoin (BTC) has failed to rise along with gold and it remains closely correlated with the U.S. stock markets.
Lloyd Blankfein, former CEO of Goldman Sachs, said that the actions of governments freezing accounts, blocking payments and the inflating U.S. dollar should all be positive for crypto but the price action suggests a lack of large inflows.

On-chain data suggests that investors may be accumulating Bitcoin for the long term. Data from Santiment shows that 21 out of the past 26 weeks have seen Bitcoin move off the exchanges.
Could Bitcoin climb back above $40,000 and pull altcoins higher? Let’s analyze the charts of the top-10 cryptocurrencies to find out.
BTC/USDT
Bitcoin has been attempting to form a base for the past few weeks. The price has been stuck inside an ascending channel with bulls buying on dips to the support line and bears selling on rallies to the resistance line.
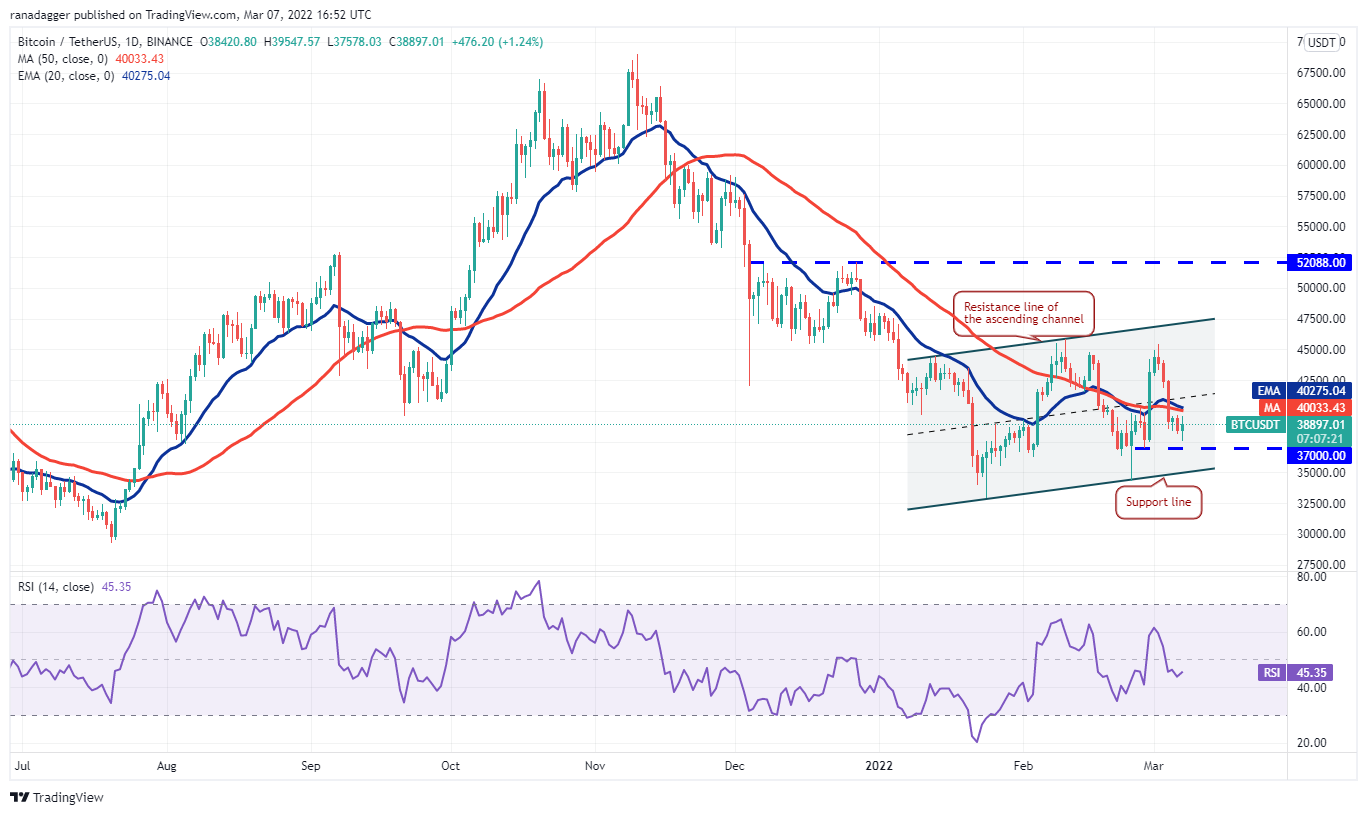
The crisscrossing moving averages and the relative strength index (RSI) near 45, indicate a minor advantage to bears. If the immediate support at $37,000 fails to hold, the BTC/USDT pair could decline to the support line of the channel.
A strong rebound off this level will suggest that bulls are accumulating at lower levels. The bulls will then attempt to push the price above the moving averages. If they do that, the pair could rise to the resistance line of the channel.
The traders should keep a close watch on a break above or below the channel as that could start a strong trending move.
ETH/USDT
Ether (ETH) broke and closed below the support line of the symmetrical triangle pattern on March 6, indicating that the continuation pattern has resolved in favor of the bears.
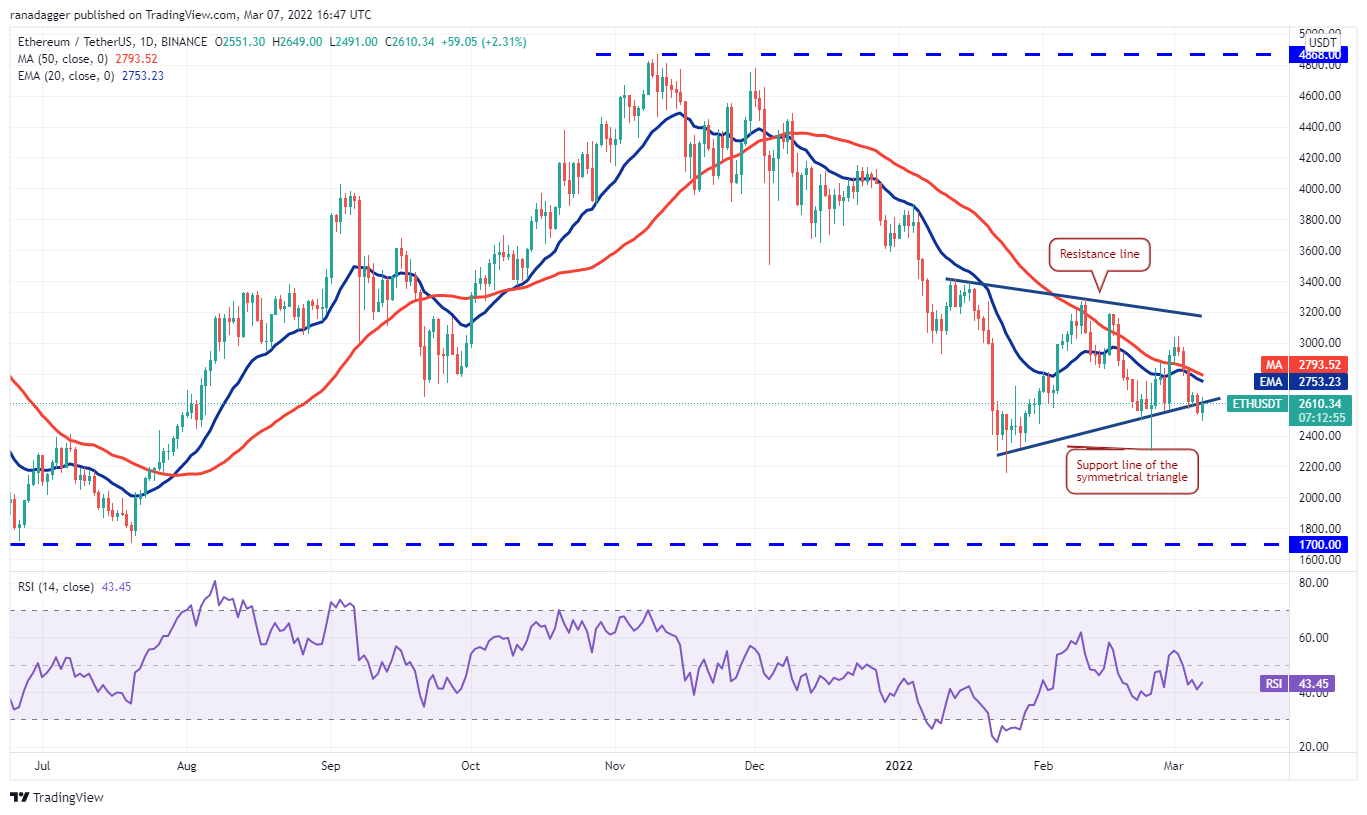
The bulls purchased the dip and are attempting to push the price back into the triangle. If they manage to do that, it will suggest that the current breakdown may have been a bear trap. A break and close above the moving averages could push the ETH/USDT pair to the psychological level at $3,000 and later to the resistance line of the symmetrical triangle.
Conversely, if the price turns down and breaks below $2,491, the prospects of a decline to the support zone between $2,300 and $2,159 increase. This is an important zone for the bulls to defend because if it cracks, the selling could intensify and the downtrend may resume. The pair could then drop toward the next strong support at $1,700.
BNB/USDT
Binance Coin (BNB) broke below the 20-day exponential moving average ($387) on March 4. The bulls tried to push the price back above the level on March 5 and March 6 but failed.
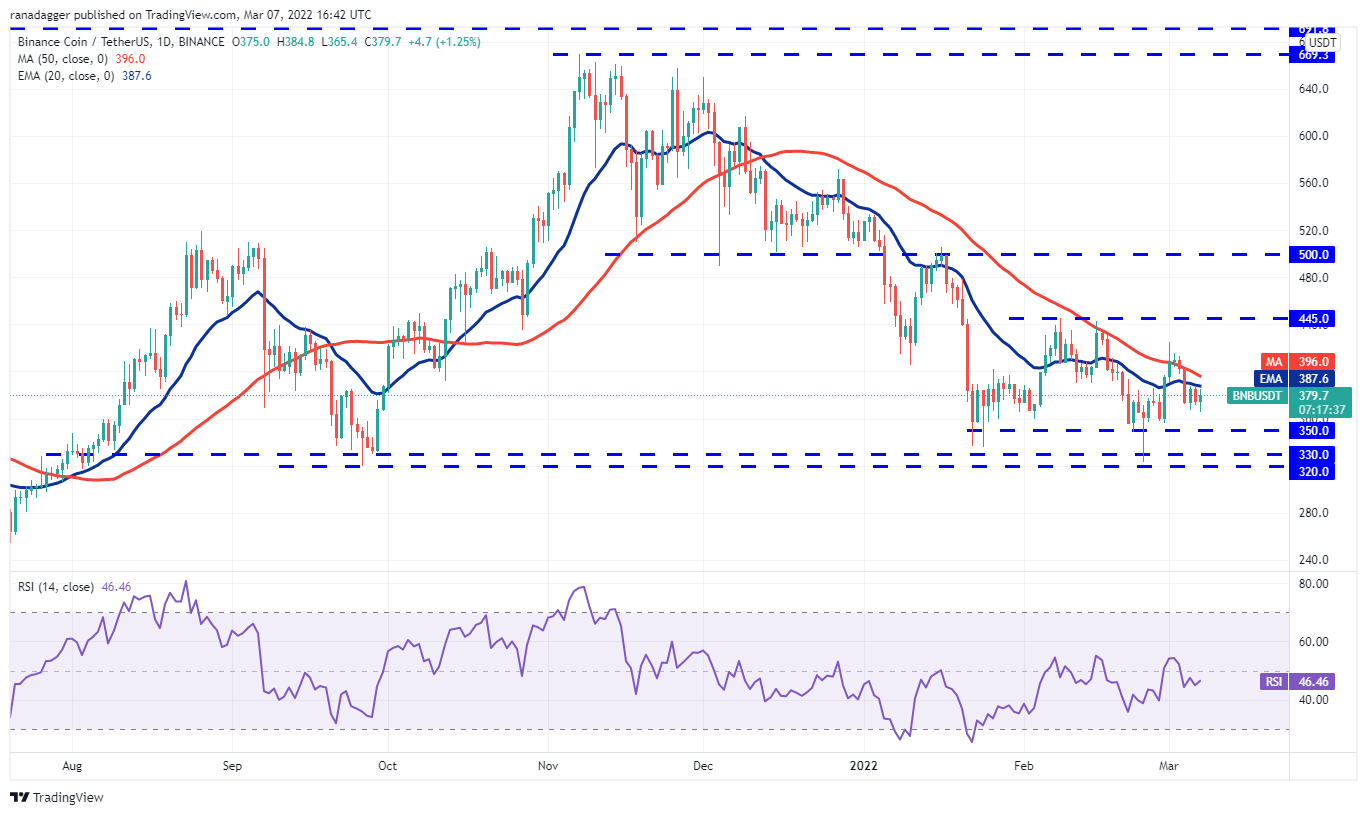
If the price sustains below the 20-day EMA, the BNB/USDT pair could drop to the strong support at $350. This is an important level to watch out for because if this level cracks, the decline could extend to the strong support zone at $330 to $320.
Conversely, if the price turns up and breaks above the moving averages, the bulls will attempt to push the pair to $425 and later to $445. This level could attract strong selling but if bulls overcome this resistance, the up-move could reach $500.
XRP/USDT
Ripple (XRP) has again bounced off the 50-day simple moving average ($0.72) indicating that bulls continue to defend the level with all their might. The buyers will now try to push and sustain the price above the downtrend line.
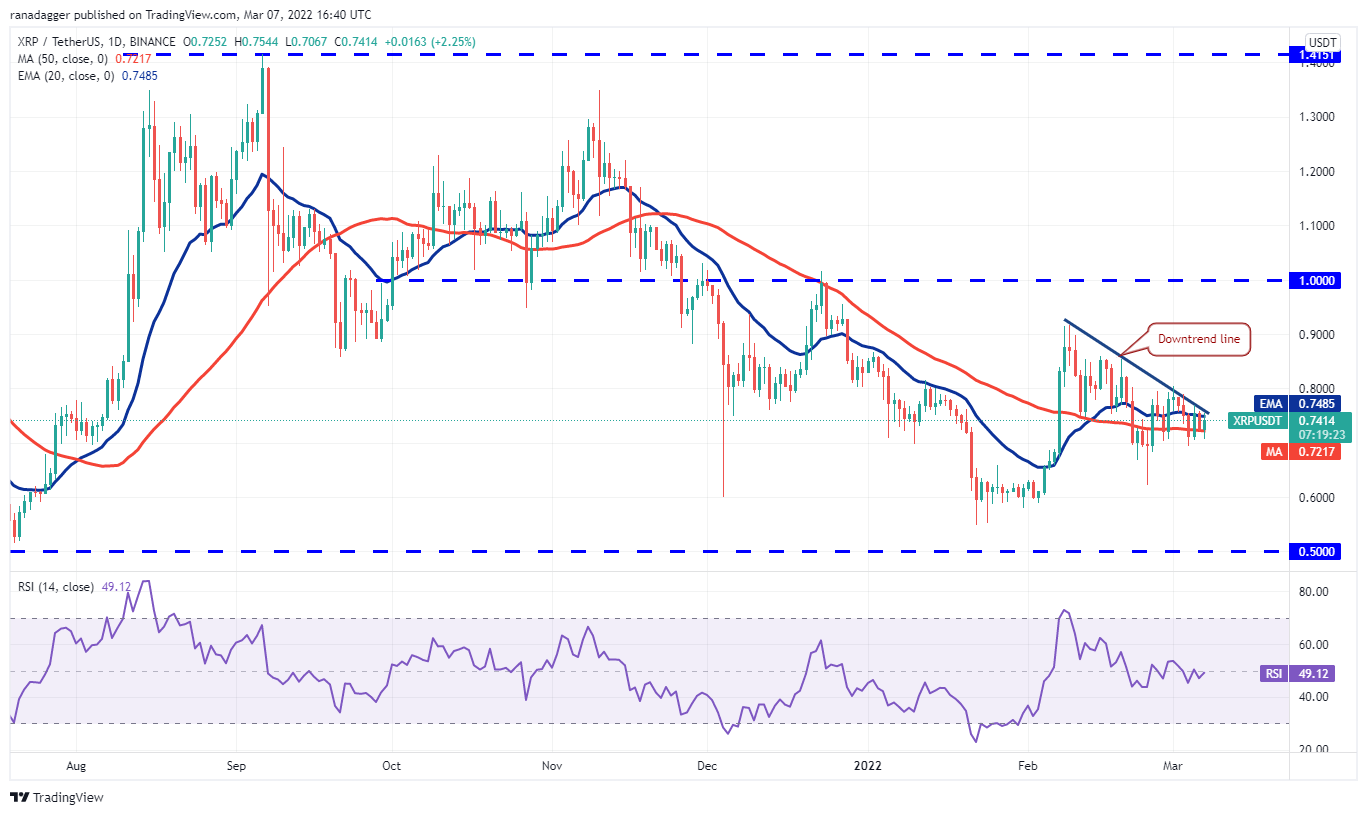
If they succeed, the momentum could pick up and the XRP/USDT pair could rise to $0.85 and then to $0.91. The bears are likely to mount a stiff resistance in the zone between $0.91 and $1. A break and close above $1 could bring the large range between $1.41 and $0.50 into play.
This positive view will invalidate in the short term if the price turns down from the downtrend line and plummets below $0.62. That could open the doors for a possible drop to the strong support at $0.50.
LUNA/USDT
Terra’s LUNA token turned down from the overhead resistance at $94 and could now drop to the 20-day EMA ($74). During uptrends, the bulls buy the dips to the 20-day EMA, hence this becomes an important level to watch out for.

If the price rebounds off the 20-day EMA, the buyers will again try to drive and sustain the LUNA/USDT pair above $94. The gradually upsloping 20-day EMA and the RSI in the positive zone indicate advantage to buyers.
A break and close above $94 could push the pair to the all-time high at $103. The bulls will have to clear this hurdle to signal the resumption of the uptrend.
Alternatively, if the price breaks below the 20-day EMA, the pair could drop to the breakout level at $70. A break below this support could suggest that the advantage may be shifting in favor of the bears.
SOL/USDT
Solana (SOL) broke below the 20-day EMA on March 4 and dropped close to the strong support at $81 on March 7. This is an important level to keep an eye on.
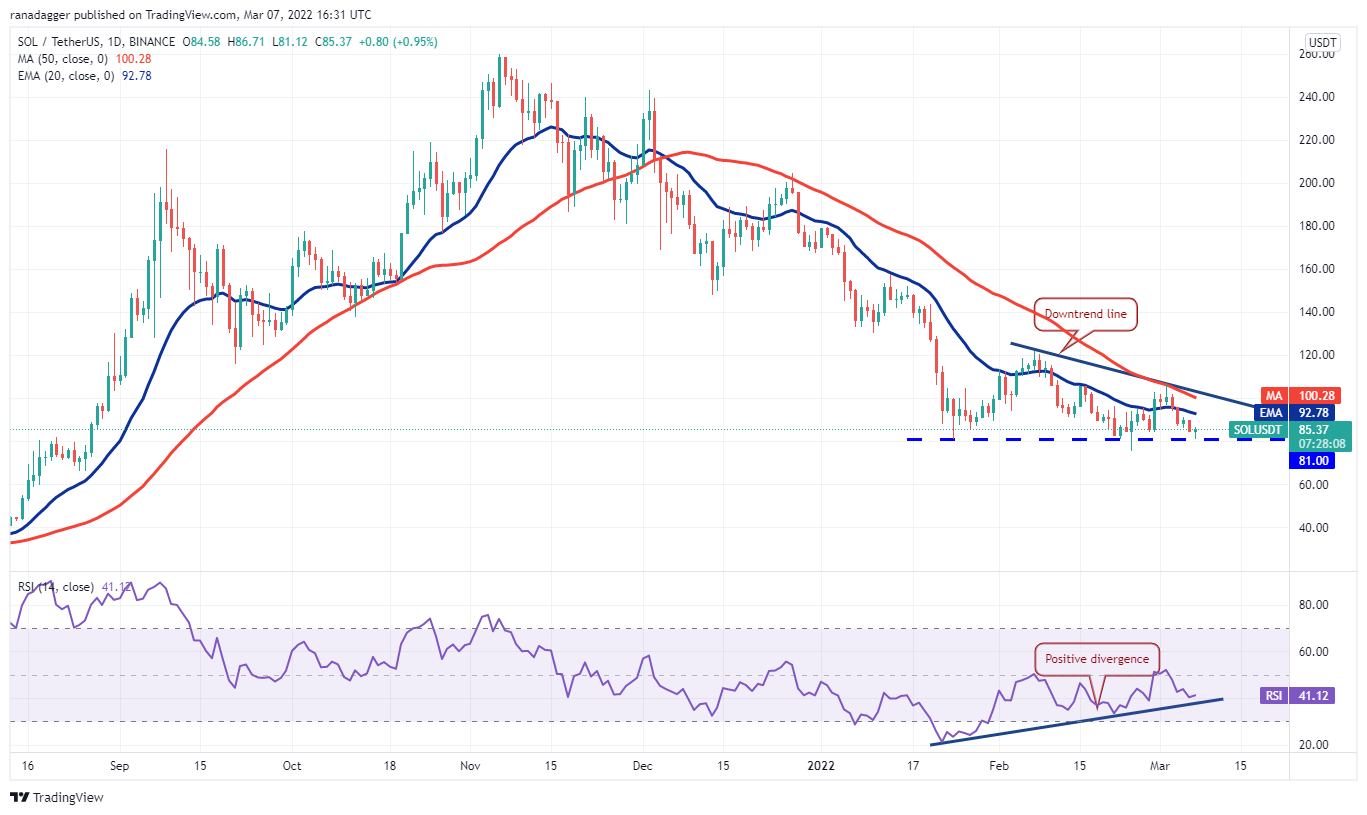
If the price breaks and sustains below $81, the SOL/USDT pair could complete a descending triangle pattern. Such a move could suggest the resumption of the downtrend. The pair could then drop to $66 and then extend its slide to the pattern target at $40.
The downsloping moving averages and the RSI in the negative territory indicate advantage to bears. Contrary to this assumption, if the price rises and breaks above the downtrend line, it will suggest that bears may be losing their grip. The pair could then rally to $122.
ADA/USDT
Cardano (ADA) bounced off the immediate support at $0.82 on March 5 but the bulls could not push the price toward the 20-day EMA ($0.92).
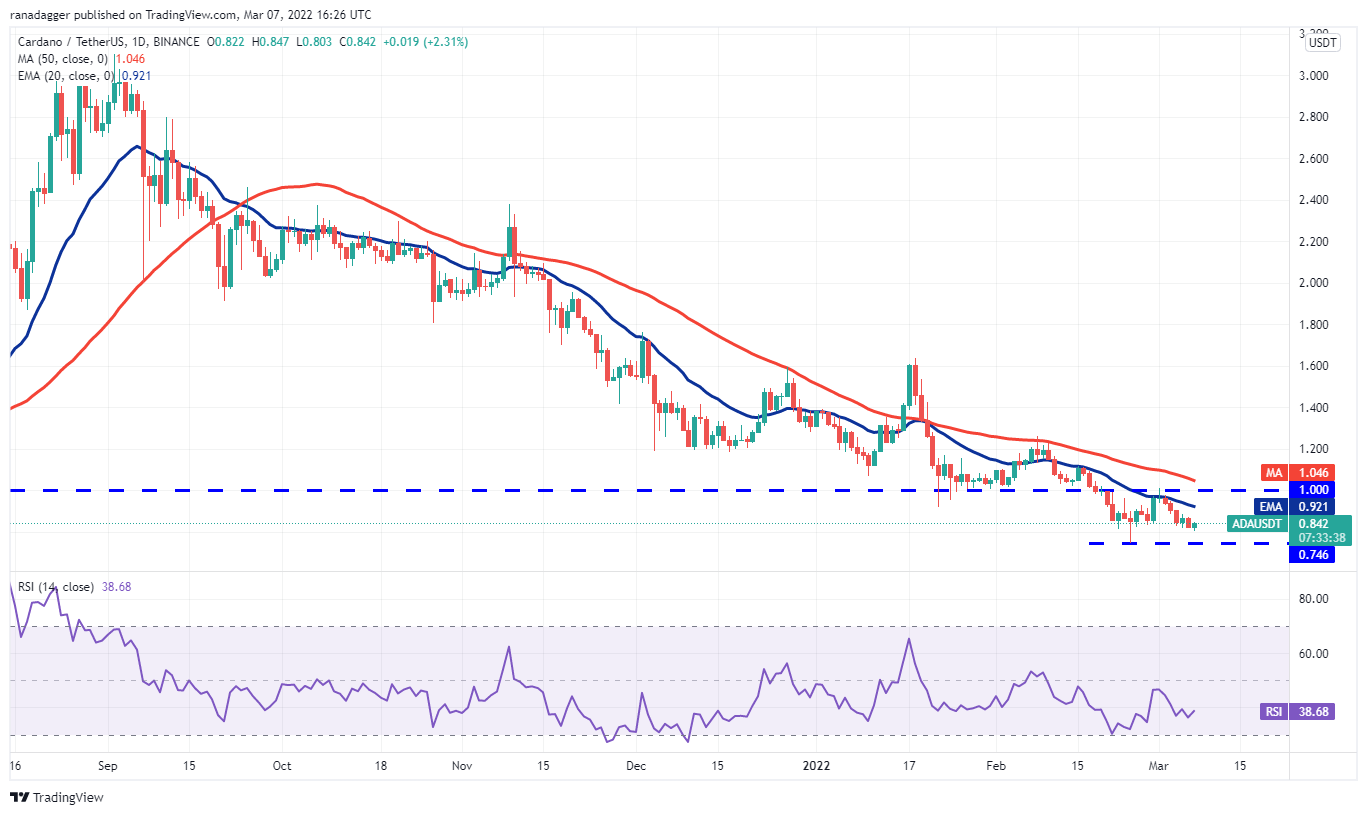
The downsloping moving averages and the RSI in the negative territory indicate that bears have the upper hand. If the price breaks and sustains below $0.82, the ADA/USDT pair could drop to the strong support at $0.74. If this support also cracks, the decline could extend to the next support at $0.68.
Alternatively, if the price rises from the current level, the bulls will again try to propel the pair above the 20-day EMA. If they manage to do that, the pair could retest the breakdown level at $1. A break and close above this level could be the first sign that the bulls are on a comeback.
Related: 3 reasons why Bitcoin can rally back to $60K despite erasing last week’s gains
AVAX/USDT
Avalanche (AVAX) slipped below the moving averages on March 4 and the bears thwarted attempts by the bulls to push the price back above the 20-day EMA ($78) on March 5.
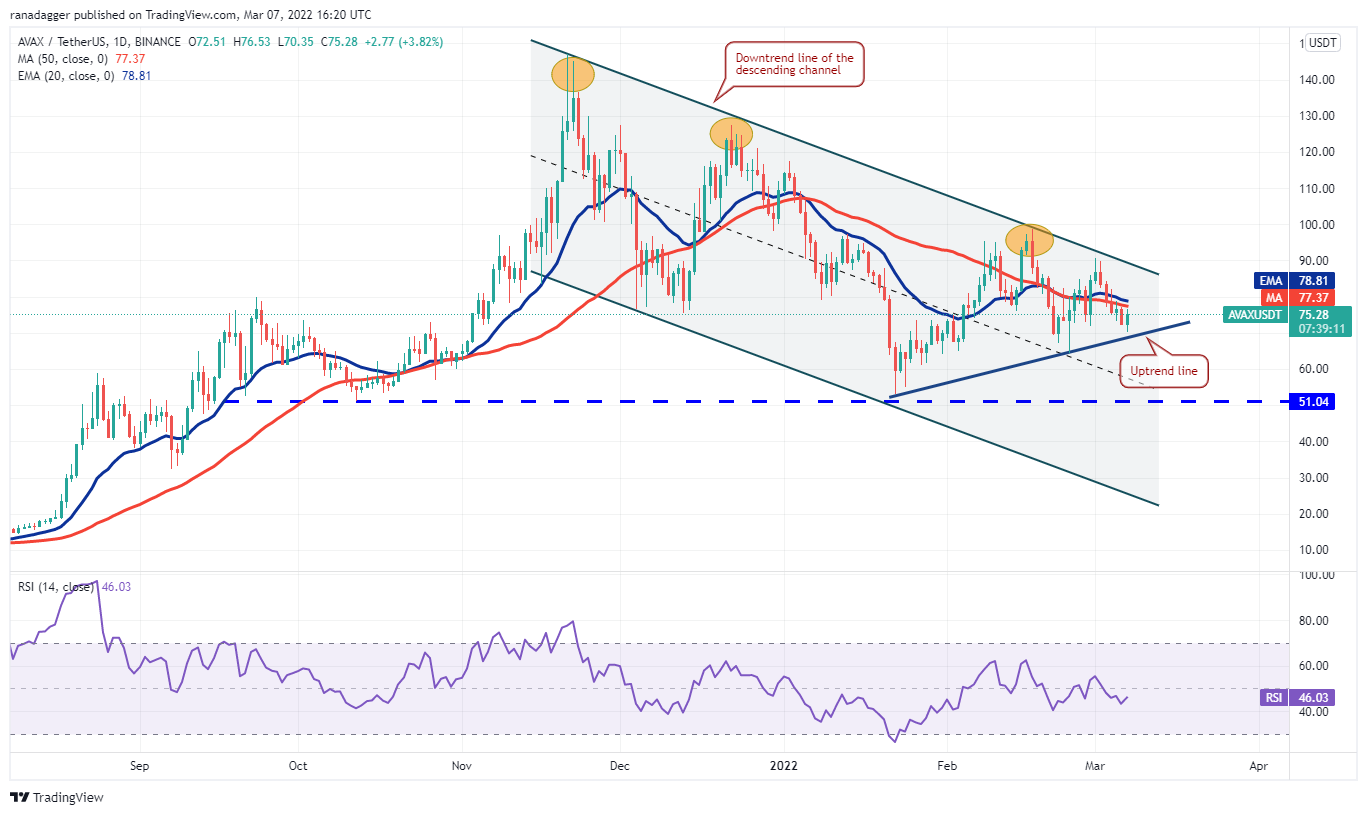
The selling resumed on March 6 and the price reached close to the uptrend line. The bulls bought this dip and are again trying to push the price above the moving averages. If they succeed, the AVAX/USDT pair could reach the downtrend line of the descending channel. The bulls will have to clear this barrier to signal a possible change in trend.
On the contrary, if the price turns down from the current level and breaks below the uptrend line, the selling could accelerate and the pair could slide toward the strong support at $51.
DOT/USDT
Polkadot (DOT) bounced off the strong support at $16 on March 5 but the bulls could not push the price above the 20-day EMA ($17). This suggests that bears are selling on rallies to this level.
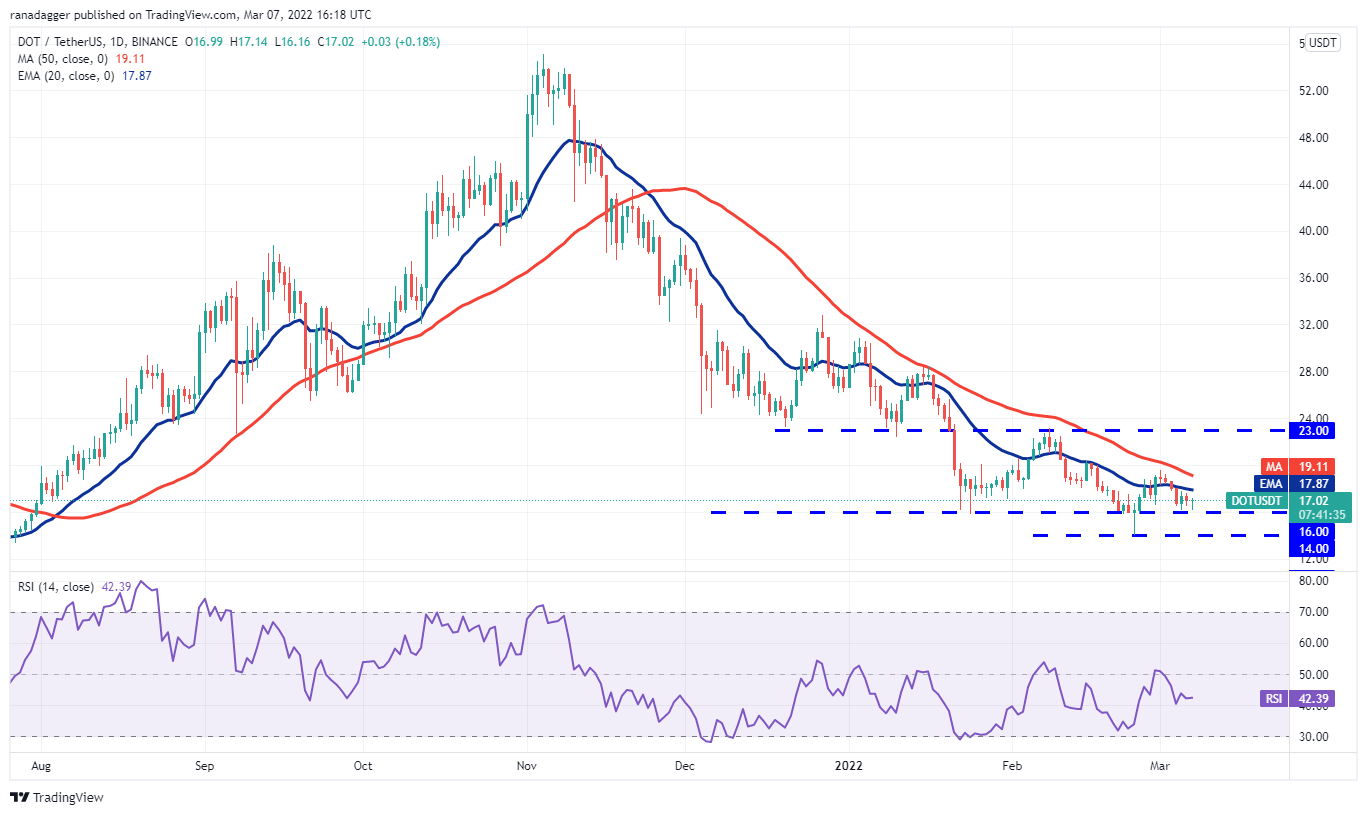
The selling resumed on March 6 and the DOT/USDT pair dropped to the strong support at $16 where buyers stepped in. This suggests that the pair is stuck between the 20-day EMA and $16.
If bears pull the price below $16, the pair could drop to the intraday low made on Feb. 24. A break and close below this support could open the doors for a further decline to $10.
Alternatively, if the price rises off the current level or rebounds off the $16 to $14 zone, the bulls will try to push the pair above the 50-day SMA ($17). If they succeed, it will suggest that the bears may be losing their grip. The pair could then rally to $23.
DOGE/USDT
The bulls are attempting to defend the strong support at $0.12 but the failure to achieve a strong rebound off it indicates a lack of demand at lower levels. This heightens the risk of a break below the support. If that happens, Dogecoin (DOGE) could drop to $0.10.
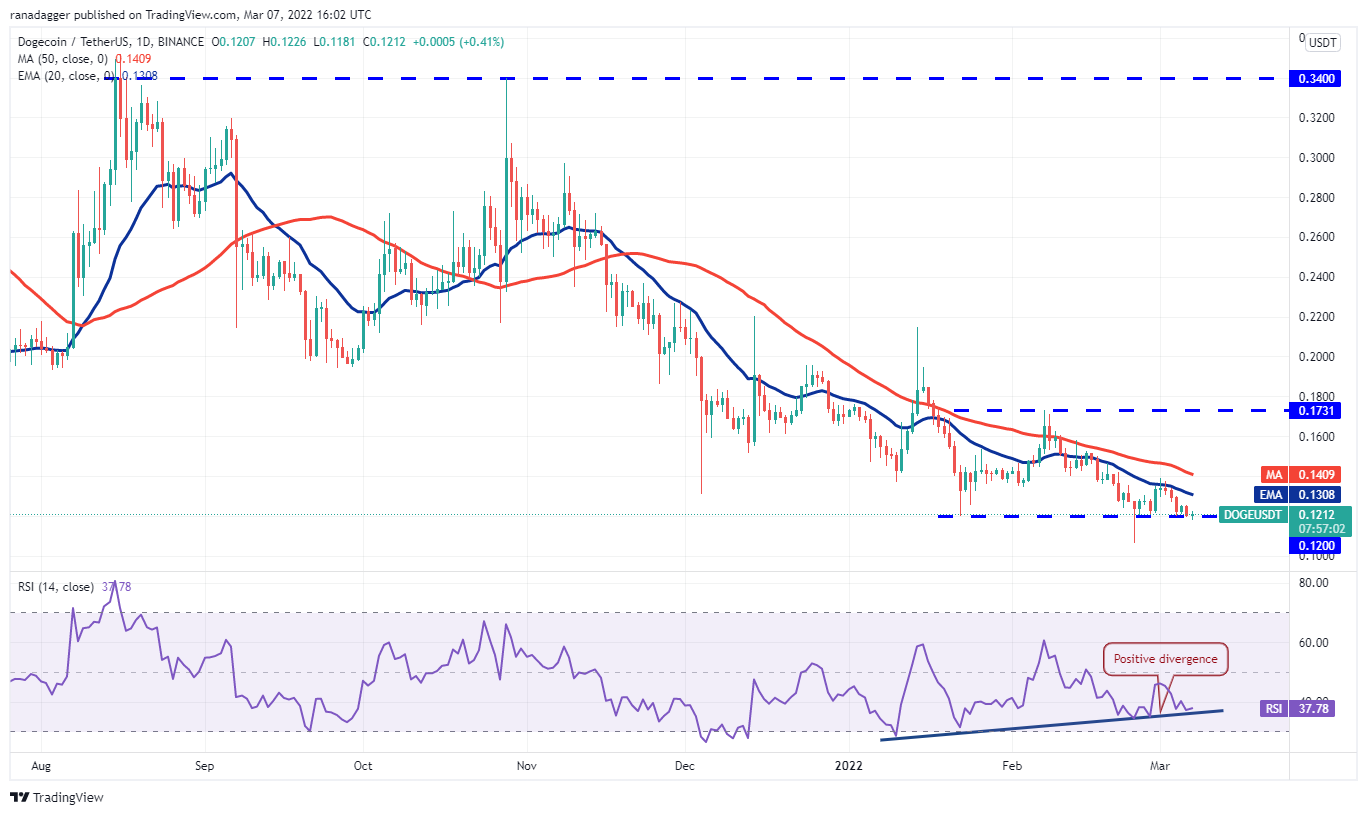
Both moving averages are sloping down and the RSI is in the negative territory, indicating that the path of least resistance is to the downside. However, the buyers are likely to defend the zone between $0.12 and $0.10 with vigor.
If the price rebounds off this zone, the bulls will again try to clear the hurdle at the moving averages. A break and close above the 50-day SMA ($0.14) will be the first sign that the downtrend could be coming to an end.
The views and opinions expressed here are solely those of the author and do not necessarily reflect the views of Cointelegraph. Every investment and trading move involves risk. You should conduct your own research when making a decision.
Market data is provided by HitBTC exchange.
|
|
Leave a Reply
You must be logged in to post a comment.