

VIX, S&P 500, GBPUSD, NZDCAD, BOC and Recession Talking Points:
- The Market Perspective: USDJPY Bearish Below 137; GBPUSD Bullish Above 1.2300; S&P 500 Bearish Below 4,030
- The VIX volatility index finally broke free of its persistent, two-month bear trend channel; but that doesn’t directly translate to a full breakdown from the S&P 500
- Monetary policy will continue to play a role in market activity with the BOC decision coming up – while anticipation for the FOMC lingers – but don’t forget the ‘recession’ signals are still flashing
Recommended by John Kicklighter
Introduction to Forex News Trading
Though major trends remain elusive for the major capital market benchmarks, that doesn’t mean that we have been left without volatility. Perhaps one of the most recognizable measures of market activity, the VIX volatility index managed to finally clear its restrictive confines of the past two months. Since establishing its peak back in early October, the so-called ‘fear gauge’ has dropped nearly 45 percent in a frustratingly (for active traders) slide to touch a low just below 19 not seen since April. Yet, activity has stirred from those depths this week. After two days of retreat in some of the more traditional ‘risk assets’, we have seen the VIX put in for its biggest two-day charge since late September and in turn break the technical resistance that has guided the market to ever-great quiet. A turn like this can evoke serious expectations, but its important to put this kind of shift into context of anticipated event risk, liquidity conditions and a healthy understanding of mean revision.
Chart of the VIX Volatility Index with 20 and 200-Day SMAs (Daily)
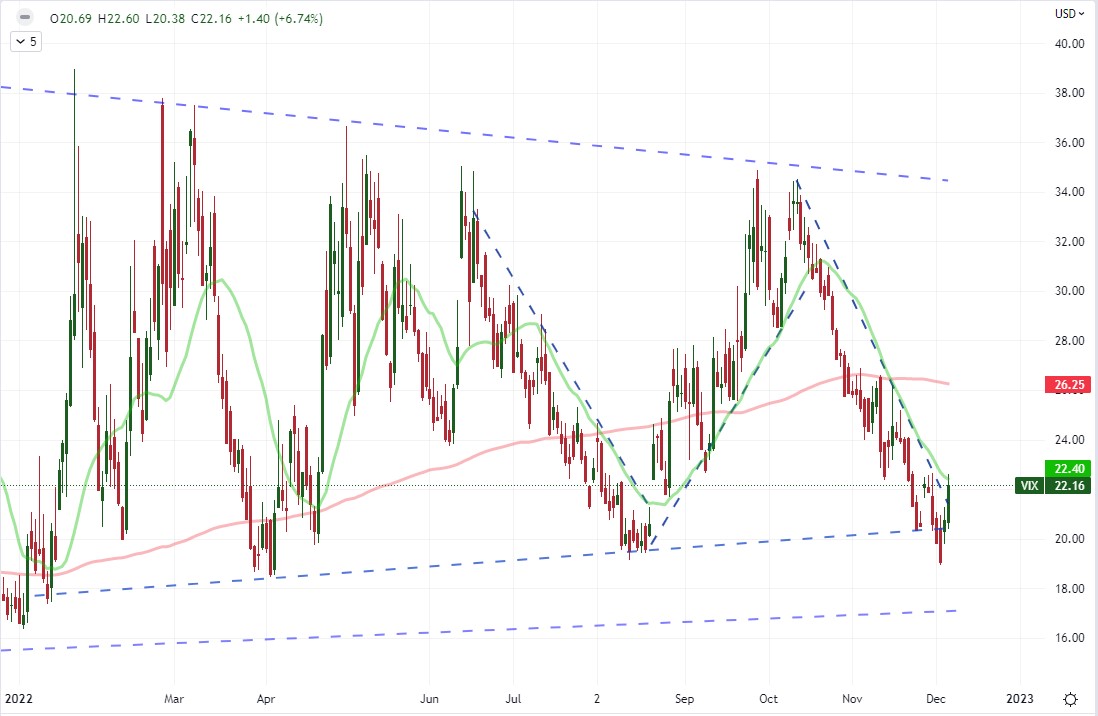
Chart Created on Tradingview Platform
Looking to the underlying behind the VIX, the S&P 500 has broken quite a few technical levels while still holding to what is essentially a heavily imbued range. From the brief break above the 200-day moving average last week, we have seen the turn lower for the benchmark equity index push us back into the frustrating range around the Thanksgiving holiday liquidity rut and event ‘take out’ the rising wedge support of the past two months. The wedge is indicative of a bull trend which is difficult to feed given the bigger picture concerns of a recession ahead along with the more immediate stifling of expectations for the FOMC rate decision next week. After the extension of the retreat this past session, the S&P 500 now has support founded in the midpoint of the August – October bear wave and the 100-day SMA. That will likely be just as difficult to break lower from as the charge above the 200-day SMA last week.
Chart of the S&P 500 Overlaid with the 20 and 200-Day SMAs (Daily)
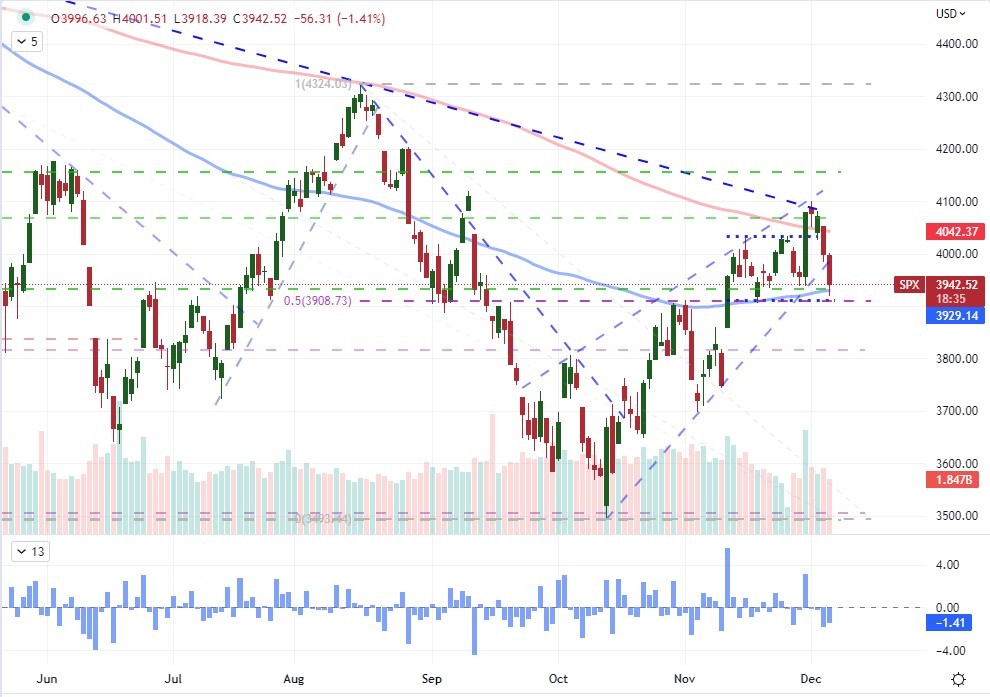
Chart Created on Tradingview Platform
Equity indices and other risk-leaning assets are the only markets with some provocative volatility and prominent technical levels. The FX market generally has a higher resting rate of implied volatility than most of its other major asset counterparts, which makes for very interesting technical pictures for the likes of EURUSD, GBPUSD and USDJPY. All of those pairs have very tight ranges and are in the midst of attempting a larger trend change which should earn our close and constant observation. However, to establish a key break – much less one with follow through – when there is the knowledge of major event next week is an improbable scenario. That said, not all markets are as land locked by anticipation. Ahead, we have the Bank of Canada (BOC) rate decision and there is debate between a 25 and 50 basis point rate hike. What’s more, swaps see that after this move we are more or less at the terminal rate. It would be more likely that we surprise here both on the outcome and the forecast. I’m watching pairs like CADJPY and NZDCD rather than USDCAD or EURCAD.
Chart of NZDCAD Overlaid with New Zealand and Canadian 2-Year Yield Differential (Daily)
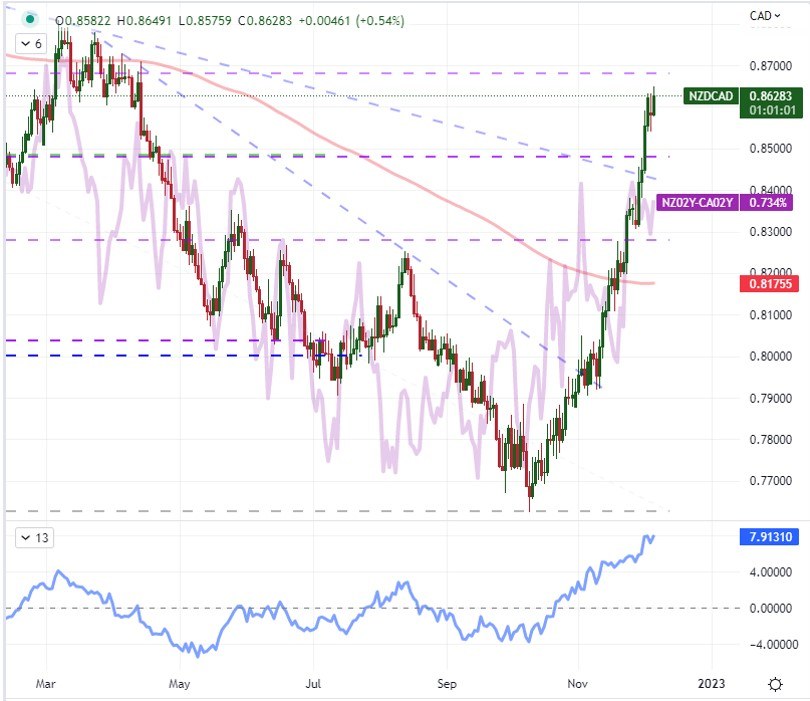
Chart Created on Tradingview Platform
While monetary policy is the more active general theme, it is important to also not loose sight of the bigger picture systemic threats like the world or major economies falling into a nasty recession. That is not a scenario easily priced into the markets. This past session the 2-year to 10-year US Treasury yield curve slipped deeper into inversion to hit a new 41-year low. I am more interested in the recent rush from the 10-year to 3-month curve to catch up to essentially the same level as that is economists’ preferred measure.
Chart of the 10-Year to 2-Year US Treasury Yield Differential (Monthly)
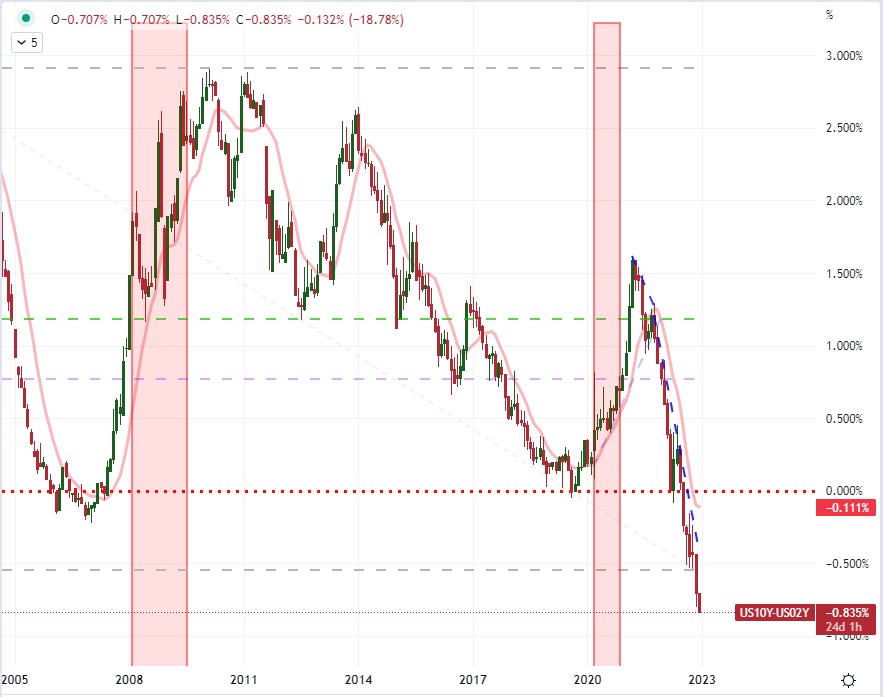
Chart Created on Tradingview Platform
|
|
Leave a Reply
You must be logged in to post a comment.