

AUD/USD ANALYSIS &TALKING POINTS
- Can AUD recover some losses as we close off the week?
- Jackson Hole in focus next week.
AUSTRALIAN DOLLAR FUNDAMENTAL BACKDROP
The Australian dollarextended it’s weekly losses on Friday without signs of a reprieve stemming from a stronger U.S. dollar and weaker than expected Australian labor data. Next week we have Australian PMI data which has been on the decline on both manufacturing and services fronts as high inflation and a slowdown in global demand hampered both segments, so it will be interesting to see whether the downward trend continues or not. Later in the week, the Jackson Hole Symposium will dominate markets as to the directional bias of the Federal Reserve after an underwhelming FOMC Minutes release earlier this week.
ECONOMIC CALENDAR
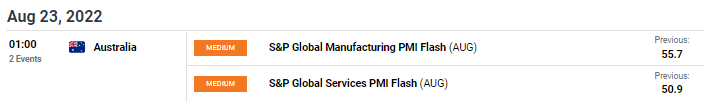
Source: DailyFX economic calendar
TECHNICAL ANALYSIS
AUD/USD DAILY CHART
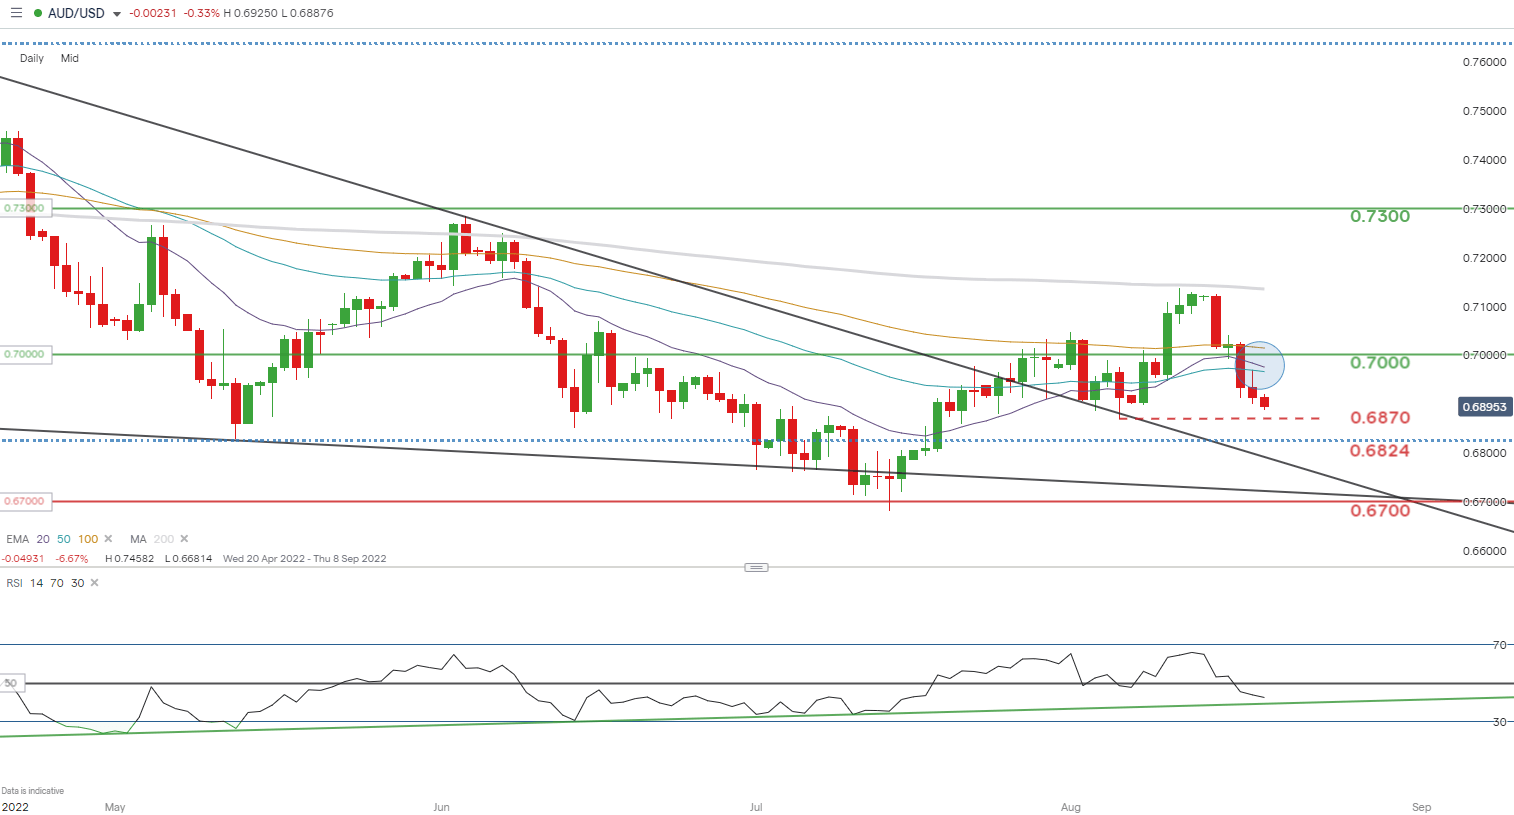
Chart prepared by Warren Venketas, IG
AUD/USD price action is heading for a key inflection point as bears test the Relative Strength Index (RSI) trendline support (green). A break below could spur further Aussie weakness coinciding with a potential bearish crossover (blue) between the 20-day EMA and 50-day EMA respectively. This being said, I believe the dollar will take a breather and allow for some respite for AUD bulls.
Key resistance levels:
- 0.7000
- 20-day EMA (purple)
- 50-day EMA (blue)
Key support levels:
- 0.6870
- 0.6824
IG CLIENT SENTIMENT DATA: BEARISH
IGCS shows retail traders are currently LONG on AUD/USD, with 65% of traders currently holding long positions. At DailyFX we typically take a contrarian view to crowd sentiment resulting in a short-term bearish disposition.
Contact and follow Warren on Twitter: @WVenketas
|
|
Leave a Reply
You must be logged in to post a comment.