

Australian Dollar, AUD/USD, RBA, Risk Trends – Talking Points
- Australian Dollar falls as Wall Street stocks end the day mixed
- RBA monetary policy meeting minutes in focus for APAC traders
- AUD/USD strength may resume on bullish SMA crossover
Tuesday’s Asia-Pacific Forecast
Asia-Pacific markets may open mixed after Wall Street closed the opening day of trading mixed. The Dow Jones Industrial Average (DJIA) fell 0.10%, while the tech-heavy Nasdaq-100 rose just over 1%. Investors weighed positive corporate earnings against slowing economic growth and rising inflation threats. The risk-sensitive Australian Dollar moved lower overnight versus the US Dollar, although the Greenback didn’t see broad strength despite
China’s GDP growth rate missing estimates on Monday likely spurred the mixed trading dynamics seen overnight. Third-quarter GDP growth slowed to 4.9% from 5.2%, according to the DailyFX Economic Calendar. That was well below the 5.2% Bloomberg consensus forecast. Industrial production and fixed asset investment also missed estimates, although retail sales surprised to the upside.
The New Zealand Dollar outperformed versus the Australian Dollar, which owes to a hotter-than-expected inflation print on Monday. New Zealand’s third-quarter GDP crossed the wires at 4.9% versus an expected 4.1% on a y/y basis. The hot CPI figure pushed RBNZ rate bets higher overnight, which fed into Kiwi Dollar strength. AUD/NZD is over 0.30% lower going into APAC trade.
Tuesday’s session will be relatively quiet, with the Reserve Bank of Australia’s October monetary policy meeting minutes set to cross the wires at 20:30 GMT. Indonesia’s central bank will release an interest rate decision. Elsewhere, crude oil prices eased overnight, driven by the Chinese GDP miss. Elsewhere, Bitcoin moved higher as the first Bitcoin futures ETF sets to launch this week.
AUD/USD Technical Forecast
AUD/USD pulled back slightly overnight but the currency pair’s gains for the month appear unthreatened. RSI and MACD look to be cooling off, but the rising 20-day Simple Moving Average (SMA) is crossing above the longer-term 50-day SMA, a bullish sign. That said, if prices move higher, the September high at 0.7478 will shift into view.
AUD/USD Daily Chart
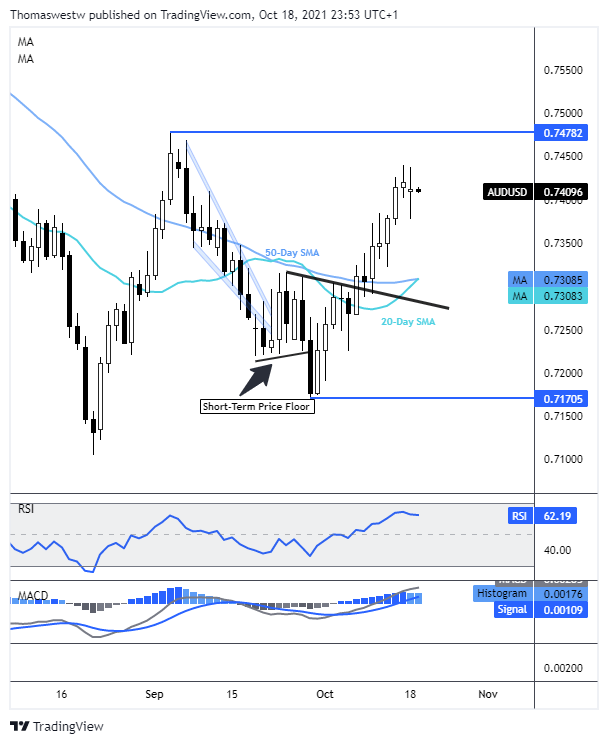
Chart created with TradingView
— Written by Thomas Westwater, Analyst for DailyFX.com
To contact Thomas, use the comments section below or @FxWestwateron Twitter
|
|
Leave a Reply
You must be logged in to post a comment.