

Australian Dollar, Aussie, AUD/USD Price Forecast:
- AUD/USD has enjoyed a very strong bullish run since the March lows.
- Aussie price action began to relax in the latter-portion of July as a big zone of longer-term resistance began to come into play.
- At this point, a rising wedge formation has formed and this will often be approached with the aim of bearish reversals. Is AUD/USD nearing a turn after a very strong four month uptrend?
Aussie Begins to Lag, AUD/USD Shows Tendencies of Turn
Like a phoenix rising from the ashes, AUD/USD put in a strong recovery following an early-year slump as price action jumped up to a fresh yearly high. While it took about two-and-a-half months for AUD/USD to crash down to a fresh 17-year low after the 2020 open, it took about another two-and-a-half months for the pair to recover the entirety of those losses, and then some.
Through it all, the .7000 big figure loomed large throughout; as this price helped to cap resistance as the New Year opened and came back into play in June after the pair had recovered. This resistance even held the advance for a little over a month, helping to hold the highs from mid-June to mid-July. But buyers eventually took out the psychological level on the way up to .7185-.7250, and that’s when the plot begins to thicken.

Recommended by James Stanley
Download our Q3 Aussie Forecast
Since that resistance zone came into play in late-July, the Aussie advance has begun to show tendencies of a stall; allowing for the build of a rising wedge formation. Such formations will often be approached with the aim of bearish reversals, driven by the logic that the same trepidation shown by bulls at tests of resistance will, eventually, play through to allow for a break of support. To learn more about such formations, there’s an entire section on rising wedges and falling wedges in the DailyFX Education section.
AUD/USD Daily Price Chart
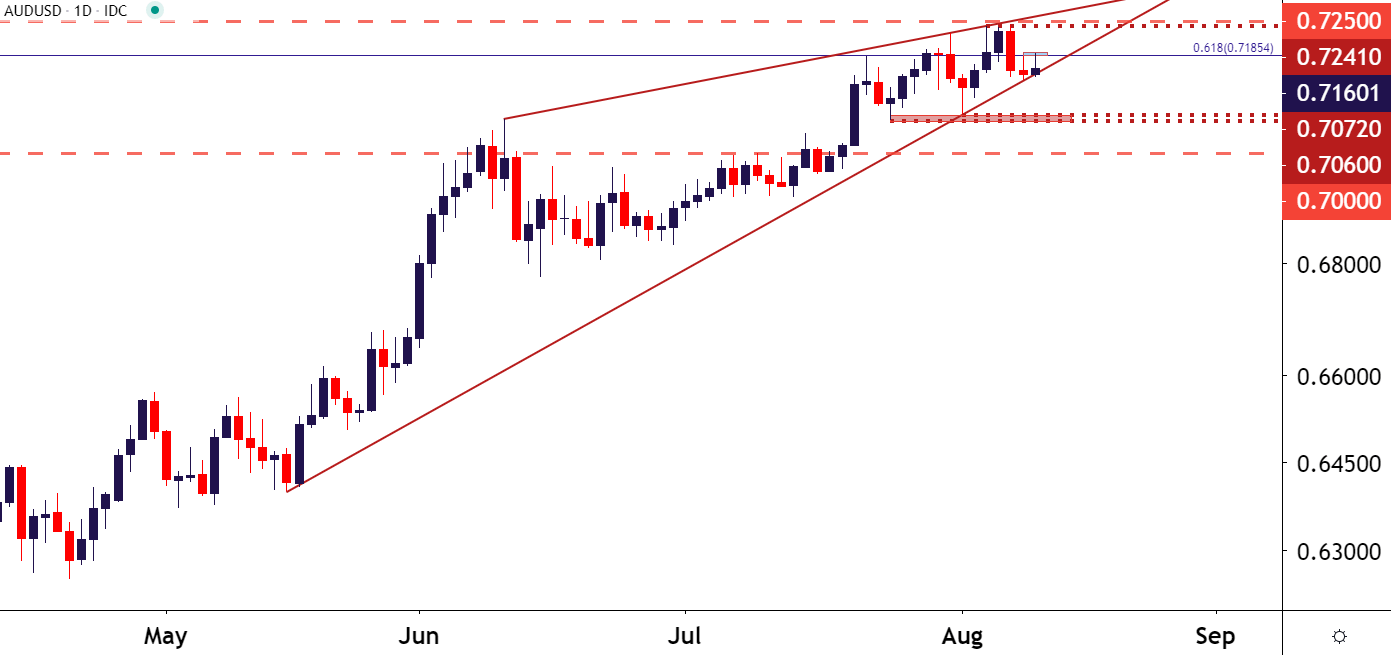
Chart prepared by James Stanley; AUD/USD on Tradingview
Going down to the two-hour chart to get a more granular look at the matter, and we can see how AUD/USD has re-engaged with the Fibonacci level at .7185. This is a big level, and has shown numerous inflections over the past couple of years as it’s the 61.8% Fibonacci retracement of the 2001-2011 major move.
Starts in:
Live now:
Aug 18
( 17:08 GMT )

James Stanley’s Tuesday Webinar
Trading Price Action
This also highlights a very recent emergence of lower-lows along with the potential for a lower-high, particularly should resistance hold in the current area. This can further support a thesis for reversal potential in the pair, looking for a hold below last week’s swing high around the .7242 area. Deeper support potential exists around the .7060-.7072 zone, after which the .7000 psychological level becomes of interest.

Recommended by James Stanley
Building Confidence in Trading
Notably, that .7000 level provided considerable resistance when price action was advancing but, to date, hasn’t shown much for support since the July breakout.
AUD/USD Two-Hour Price Chart
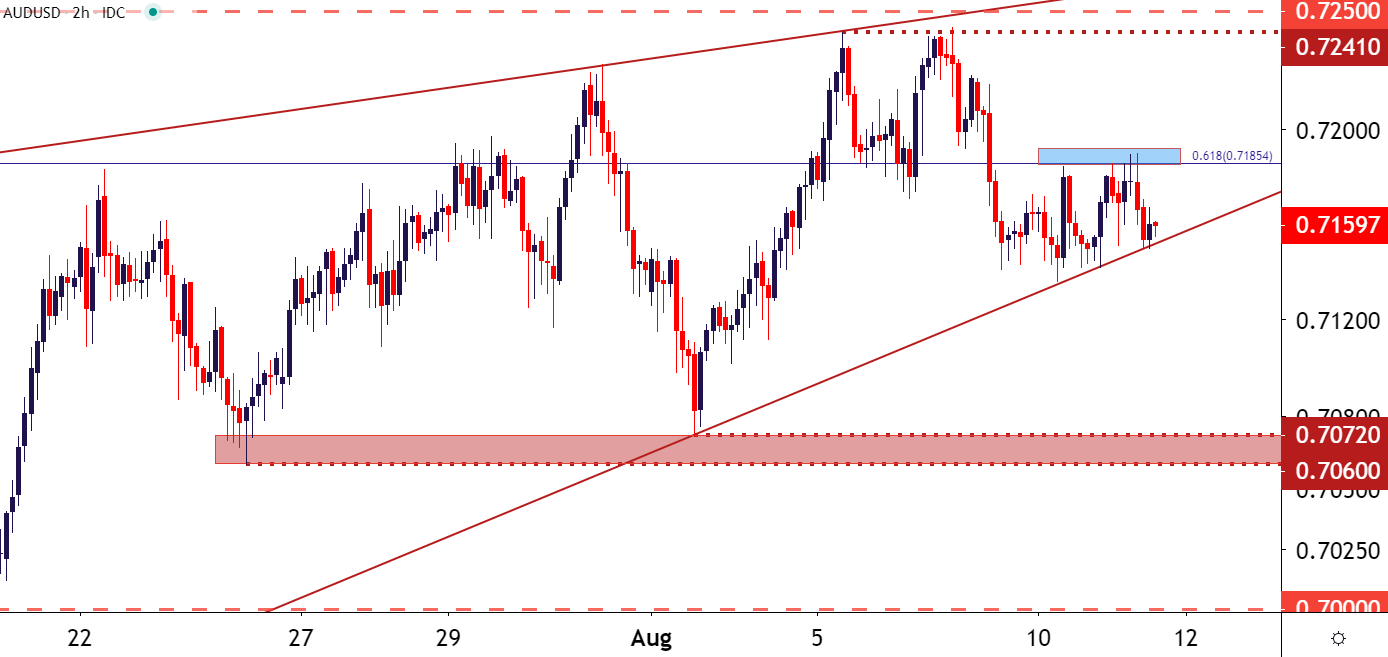
Chart prepared by James Stanley; AUD/USD on Tradingview
— Written by James Stanley, Strategist for DailyFX.com
Contact and follow James on Twitter: @JStanleyFX
|
|
Leave a Reply
You must be logged in to post a comment.