

Bitcoin (BTC/USD) Prices, Charts, and Analysis
- Bitcoin futures ETF – when not if?
- Bitcoin all-time high likely to be tested soon.
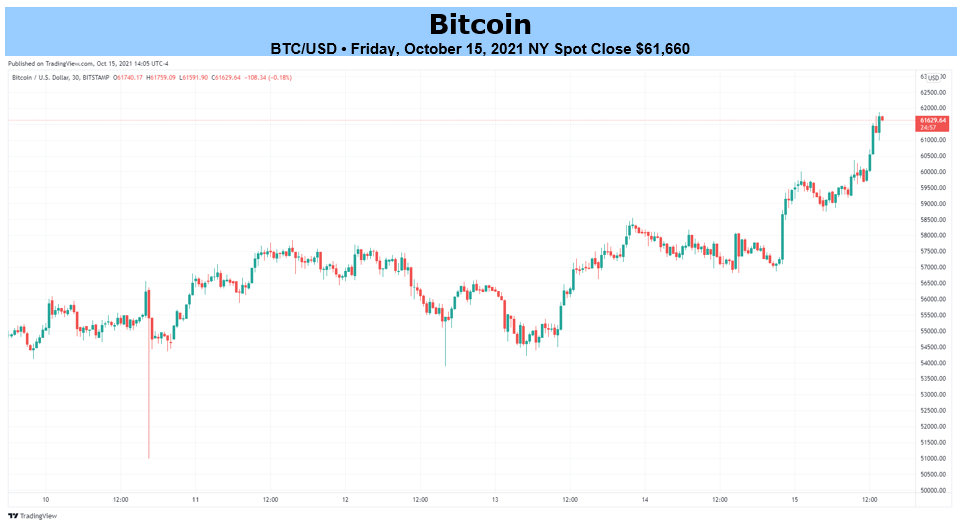
Talk of a futures-based Bitcoin ETF has been swirling around the market for months but recent commentary suggests that the SEC may soon approve at least one if not two applications as early as next week. Recent reports suggest that two ETF proposals by ProShares and Invesco may be given the green light next Tuesday to launch their products, although the SEC can still pull the plug by Monday evening. If one or both of these ETFs launch next week, the other applications in the SEC’s in-tray will need to be looked at as a matter of urgency to try and dampen down first-mover advantage. While many believe that the recent move higher in Bitcoin has been in anticipation of an ETF announcement, the underlying cash market will continue to be underpinned, and driven higher, by demand for futures. The recent all-time high at just under $65k is likely to come under increasing pressure in the near term as demand outstrips limited supply.
Bitcoin (BTC/USD) Breaks $60k on Growing Futures-Based ETF Expectations
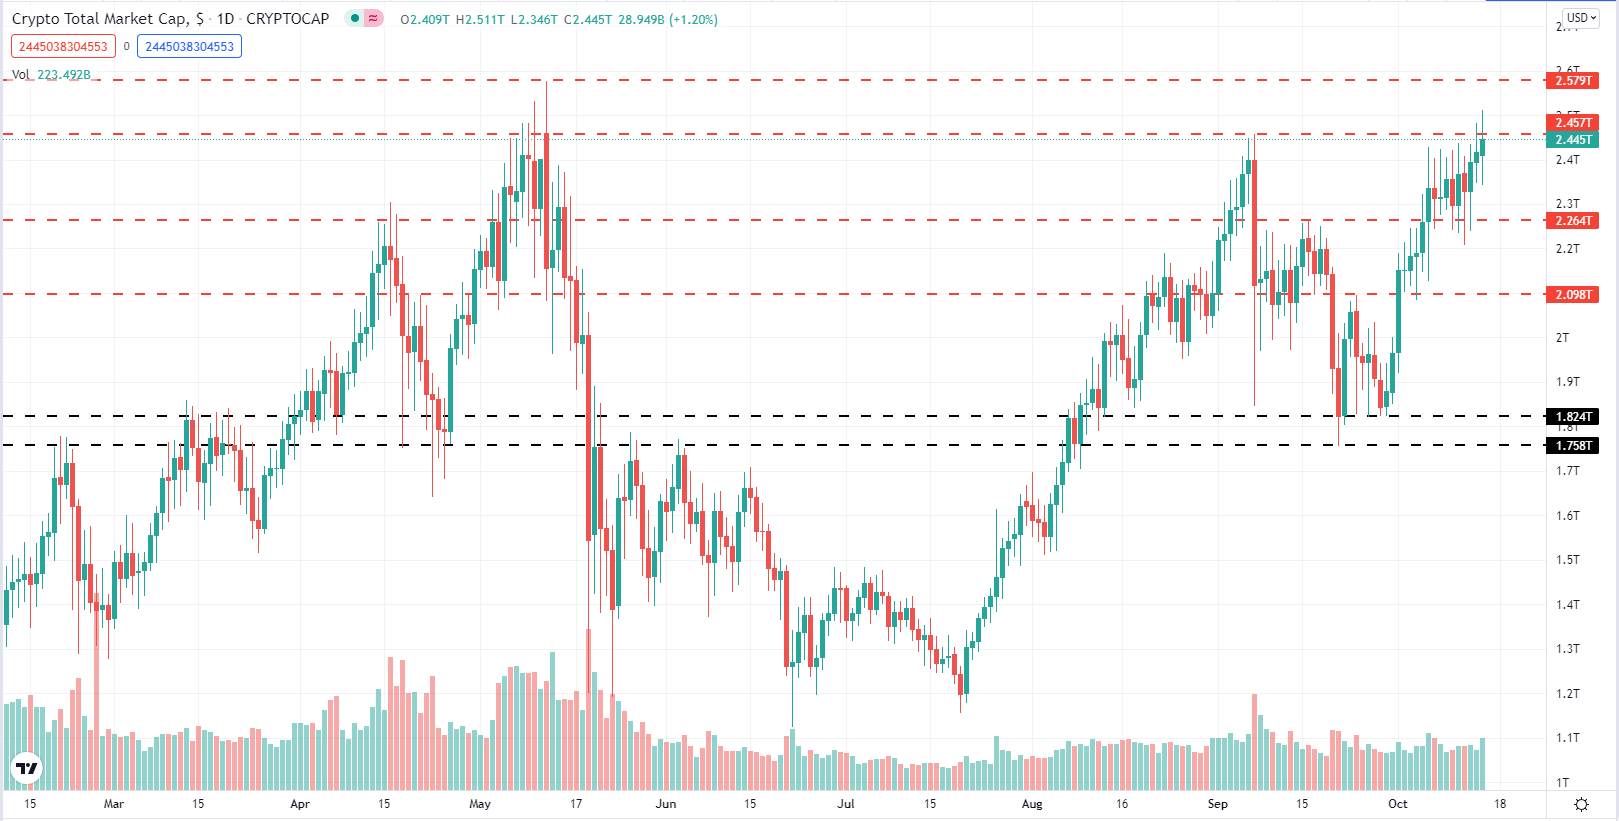
The crypto market as a whole continues to expand and is nearing its best–ever level as a series of higher highs continues to dominate the chart over the last month. As with Bitcoin, the all-time high market cap is likely to fall soon, especially if the ETF story plays out.
Cryptocurrency Total Market Capitalization – October 15, 2021
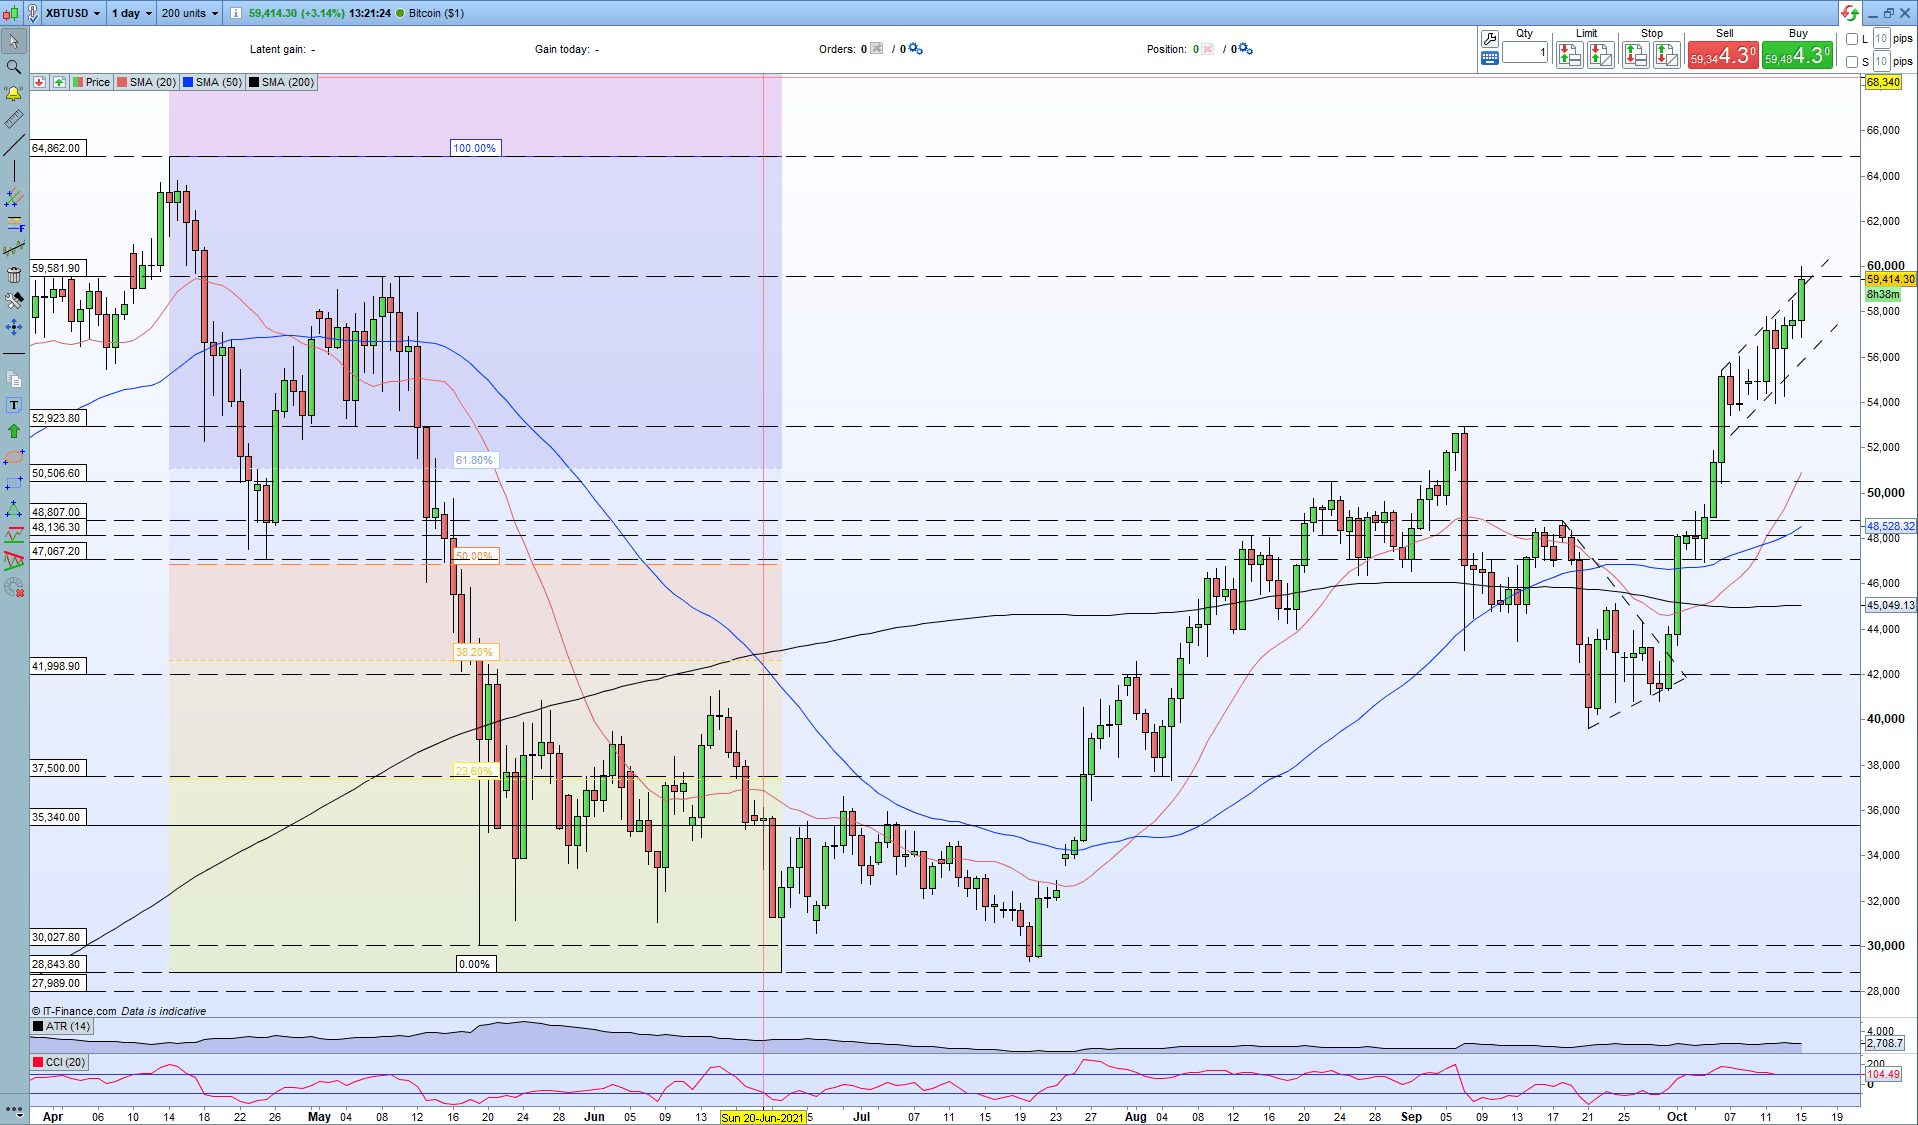
We have been bullish on Bitcoin over the past few weeks, not just on the overwhelmingly positive sentiment in the space, but also due to a bullish technical chart set-up. The daily chart shows a classic break out of a bullish pennant at the start of October, while the recent uptrend has provided tradeable support and resistance levels over the last 10 days. Added to this a bullish simple moving average set-up, with the 20-day sma turning sharply higher, while the CCI indicator has not touched extreme overbought levels. As it stands, there is little in the way of technical resistance before we hit April’s all-time high and this may even happen ahead of Tuesday’s ETF announcement if the market continues at its current pace.
Bitcoin Daily Price Chart – October 15, 2021
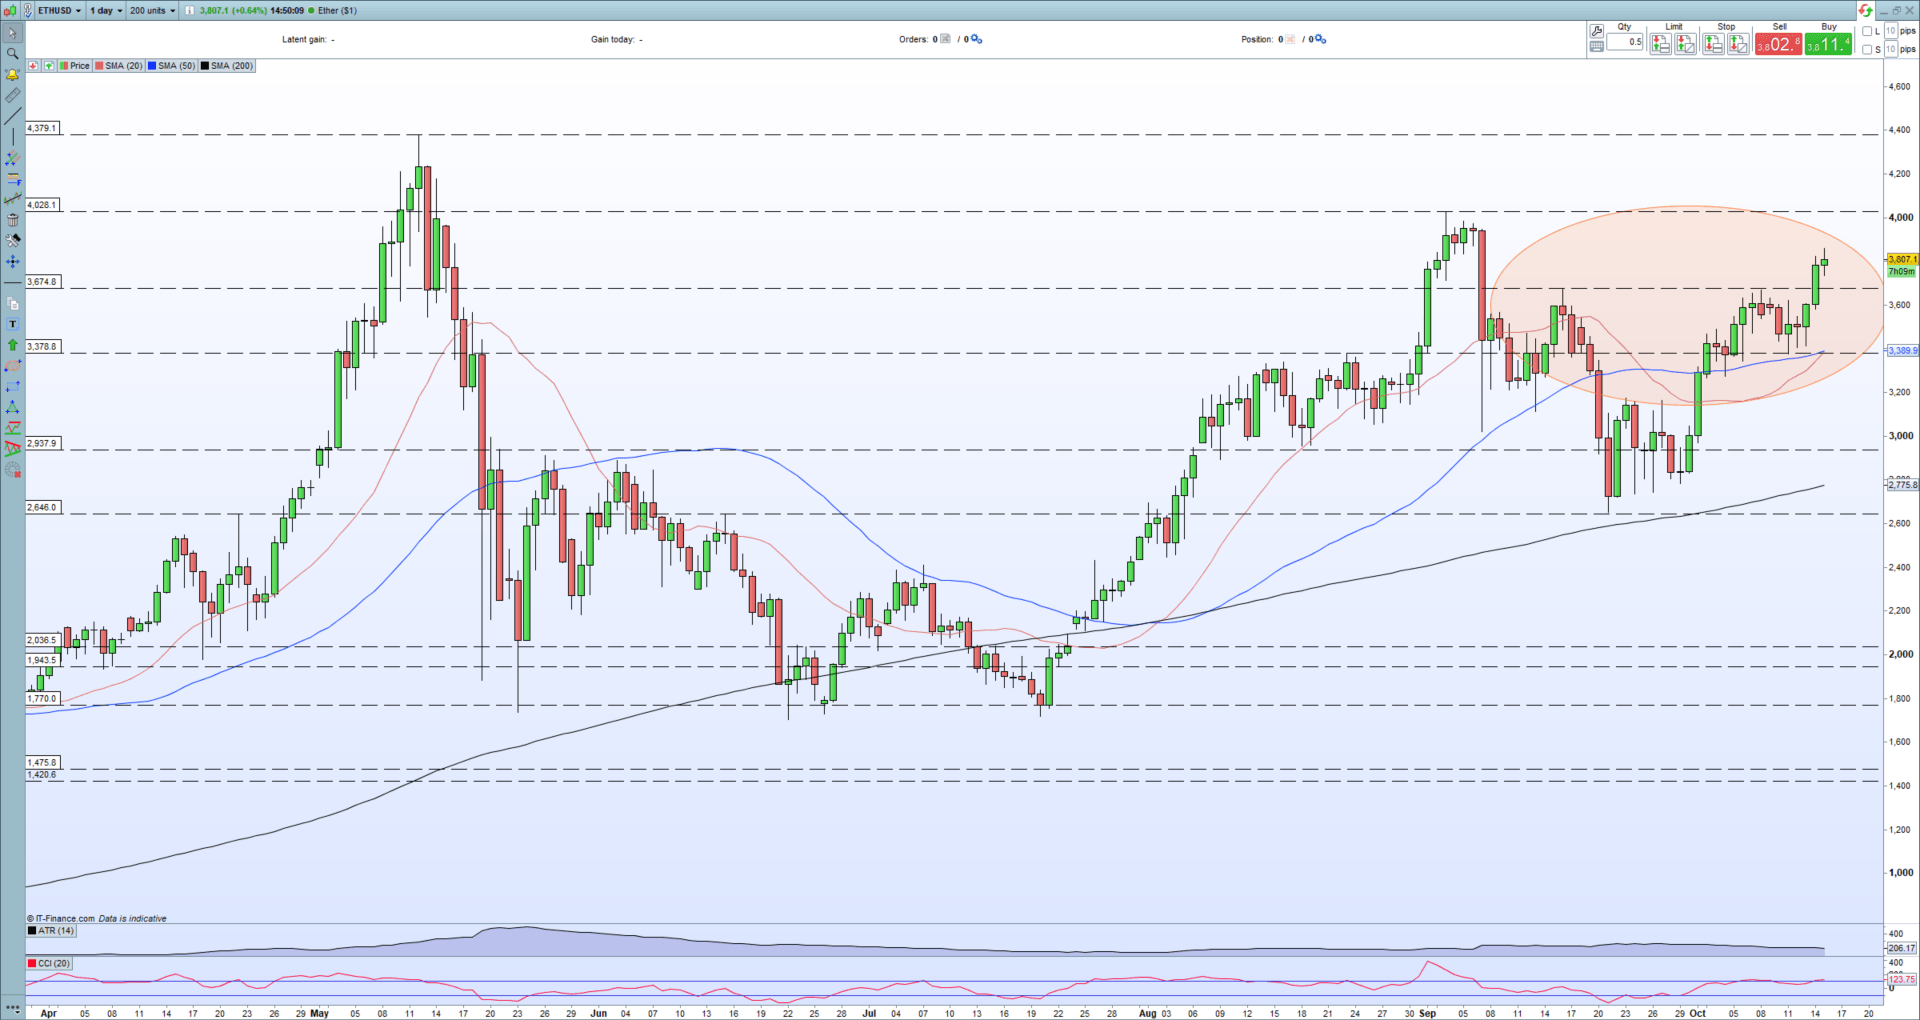
Ethereum is another crypto with a positive chart set-up, confirmed by a break and open above a prior horizontal resistance level. While Bitcoin leads the current march higher, Ethereum is likely to come back into the spotlight soon and test its prior high.
Ethereum (ETH) Primed to Break Higher as Resistance Comes Under Renewed Pressure
Ethereum Daily Price Chart – October 15, 2021
What is your view on Bitcoin (BTC) – bullish or bearish?? You can let us know via the form at the end of this piece or you can contact the author via Twitter @nickcawley1.
|
|
Leave a Reply
You must be logged in to post a comment.