

Bitcoin, USD Talking Points
- Bitcoin prices shows initial sensitivity to positive NFP report
- BTC/USD continues to challenge $38,000
- USD strength remains a key catalyst for digital assets
Positive NFP report forces BTC lower, bulls immediately retaliate
Bitcoin prices have continued to trade within a well-defined range as bulls continue to wrestle with trendline resistance.
Despite a test of the above-mentioned level, the release of an unexpectedly optimistic NFP report, USD strength and the probability of a faster pace of tapering allowed bears to temporarily drive prices below $38,000 but prices soon managed to recover.
As risk sentiment and major event risk continue to drive sentiment, Bitcoin prices remain between key technical levels which will likely play an additional role in driving price action for the imminent move.
Visit the DailyFX Educational Center to discover the importance of employment data in Forex
Bitcoin (BTC/USD) Technical Analysis
In response to the positive NFP report earlier today, Bitcoin prices edged lower temporarily before bulls retaliated, driving price action back towards $38,000.
Bitcoin 5 Minute Chart
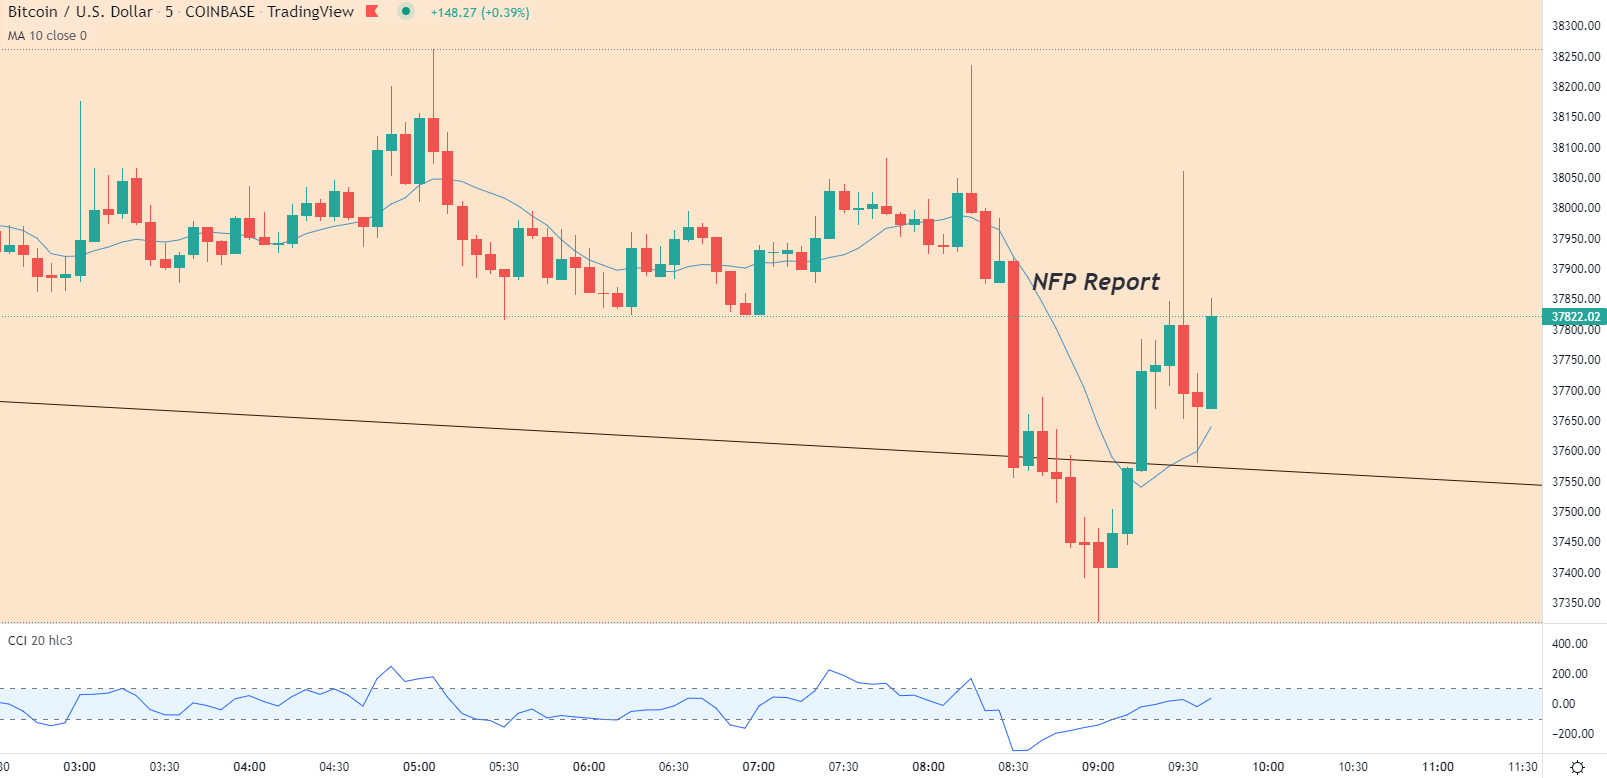
Source: TradingView, Chart by Tammy Da Costa
At the time of writing, BTC/USD is currently retesting the 10-period moving average (MA) and towards $38,000. With a bout of economic activity and volatility entering the markets, BTC continues to trade within a well-defined range, between the respective psychological levels of $36,000 and $40,000.
Bitcoin (BTC/USD) Daily Chart
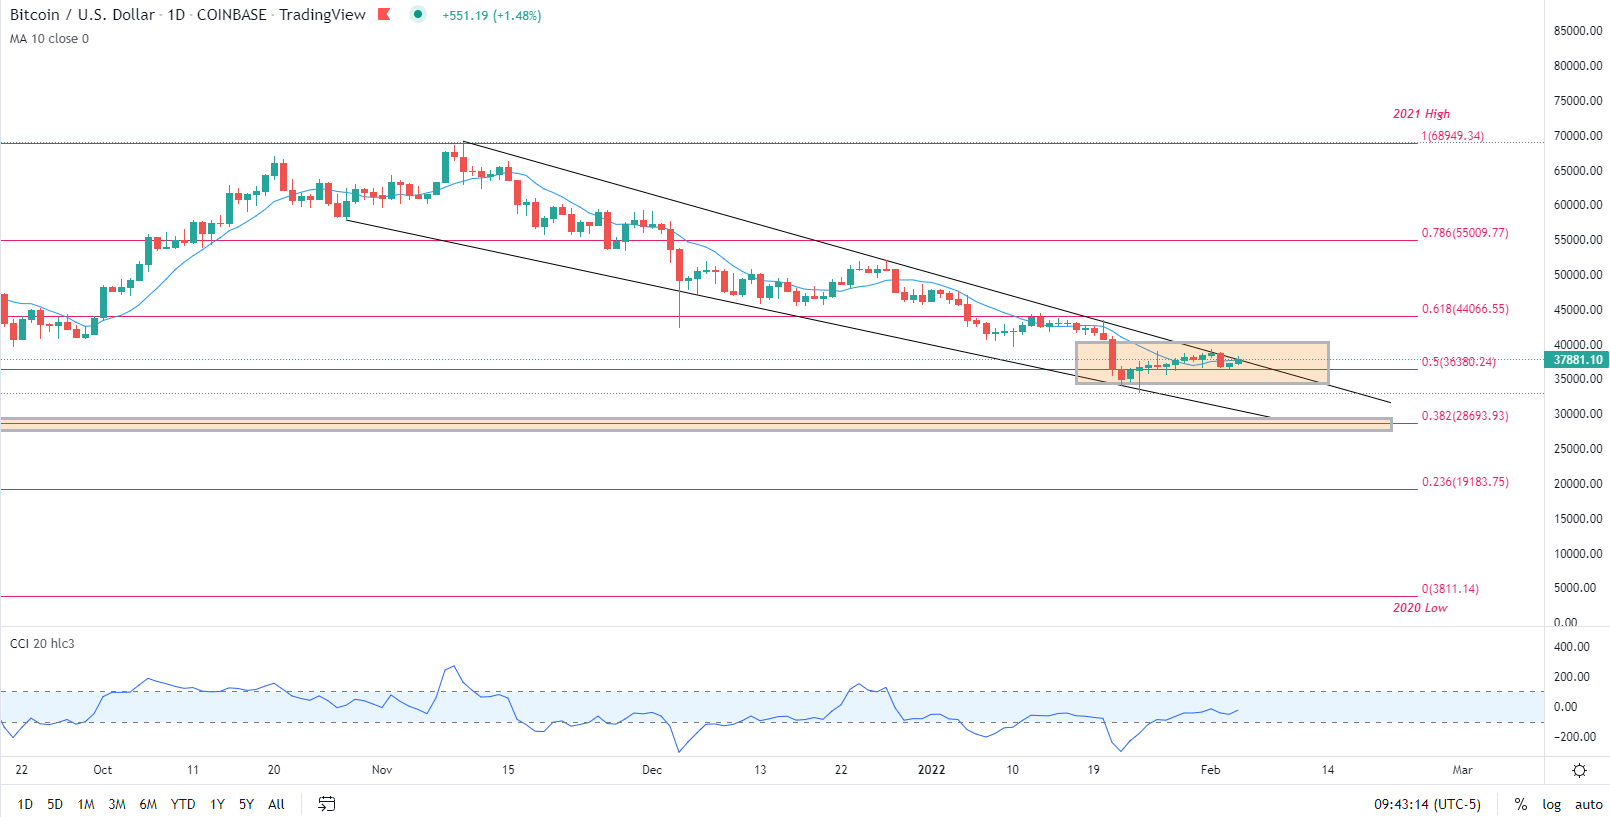
Source: TradingView, Chart by Tammy Da Costa
Meanwhile, on the weekly time-frame, the formation of a doji candle at a critical zone of trendline resistance is a possible indication of indecision as price action searches for direction.
With the CCI (commodity channel index) threatening oversold territiory, a declining trendline and key fibonacci retracement levels are suggestive that bearish pressure may persist for as long as prices remain below $40,000.
Bitcoin (BTC/USD) Weekly Chart
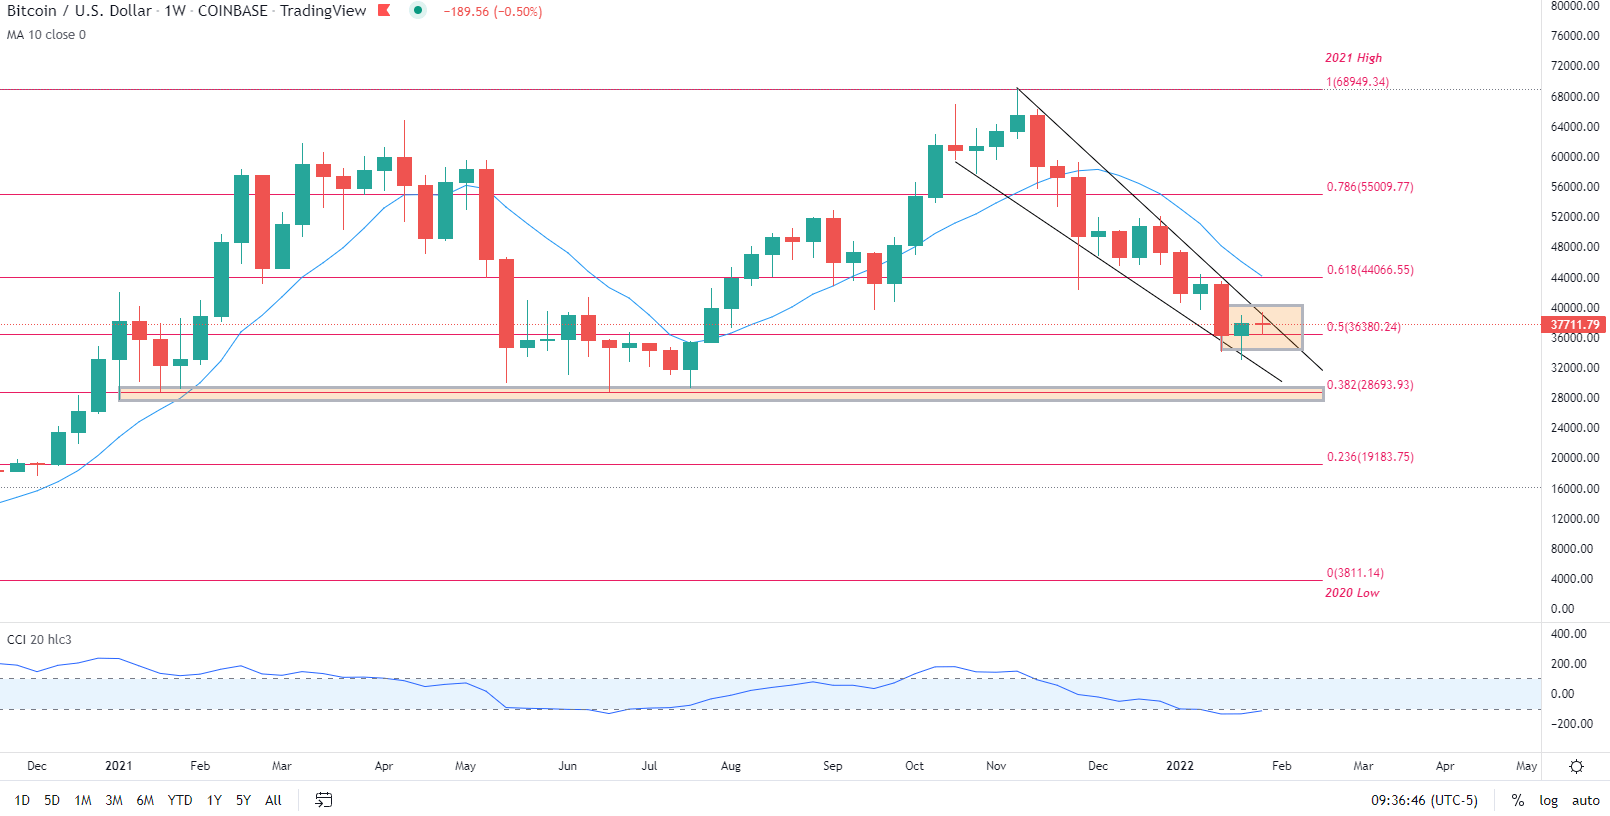
Source: TradingView, Chart by Tammy Da Costa
— Written by Tammy Da Costa, Analyst for DailyFX.com
Contact and follow Tammy on Twitter: @Tams707
|
|
Leave a Reply
You must be logged in to post a comment.