

GBP price, news and analysis:
- After falling below 1.40 near the end of last month, there is now substantial resistance for GBP/USD at that level, which has been tested several times since then, and the pair continues to slip further away from it.
- The Bank of England’s monetary policy committee will leave UK interest rates and its asset purchases unchanged Thursday so the main focus will be any guidance on how the central bank sees the outlook for growth and inflation.
Advertisement
GBP/USD still slipping lower
GBP/USD continues to ease back ahead of Wednesday’s announcement by the US Federal Reserve and Thursday’s announcement by the Bank of England’s monetary policy committee. The BoE will leave both UK interest rates and its asset purchases unchanged so the principal interest will be on any guidance on how it sees the outlook for economic growth and inflation.
Ahead of that meeting, GBP/USD has fallen for three of the past four sessions. Since dropping below the 1.40 level in late February it has failed repeatedly to move back above it so there is now significant resistance at that level and the easiest path for the pair seems to be downwards.
GBP/USD Price Chart, Daily Timeframe (December 14, 2020 – March 16, 2021)
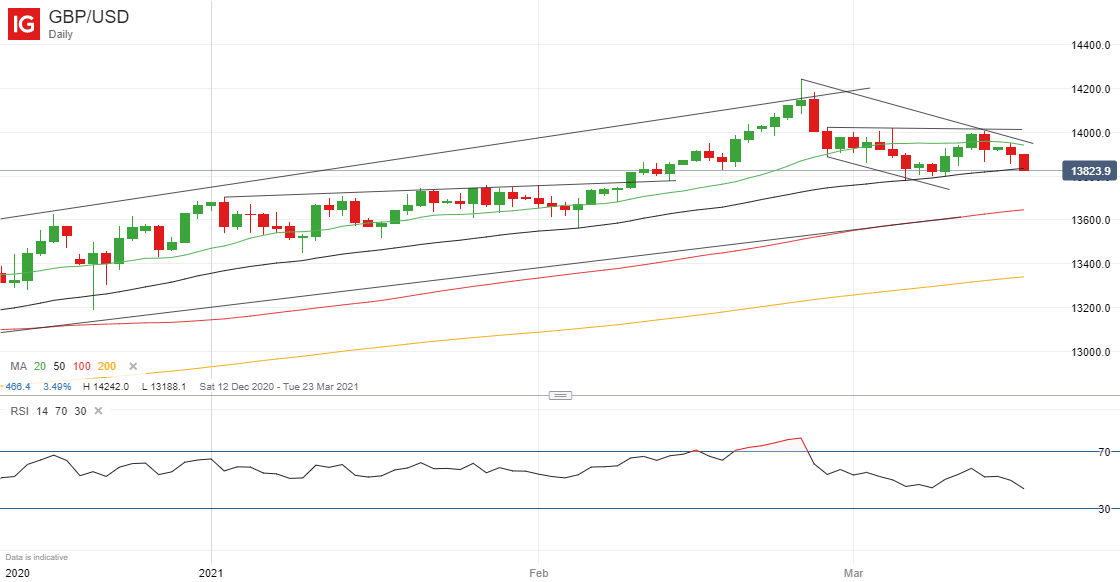
Source: IG (You can click on it for a larger image)
Recommended by Martin Essex, MSTA
How to Trade GBP/USD
Recent speeches have suggested a mild difference in tone between Bank of England Governor Andrew Bailey and Chief Economist Andy Haldane, who seems a little more optimistic about the outlook. Bailey has described the risks as now “increasingly two-sided” while Haldane has talked of a strong recovery from the pandemic slump. If there is a difference between them, however, it will not surface Thursday.
| Change in | Longs | Shorts | OI |
| Daily | 14% | -11% | 2% |
| Weekly | 7% | 1% | 4% |
Note in passing that the Pound is also a tad weaker against the Euro, with EUR/GBP edging higher. However, that is probably just profit-taking after the pair moved into oversold territory. As the chart below shows, the 14-day relative strength index (RSI) dropped below the 30 level signaling an oversold market but has since moved back above it, suggest the cross could soon start weakening again.
EUR/GBP Price Chart, Daily Timeframe (November 30, 2020 – March 16, 2021)
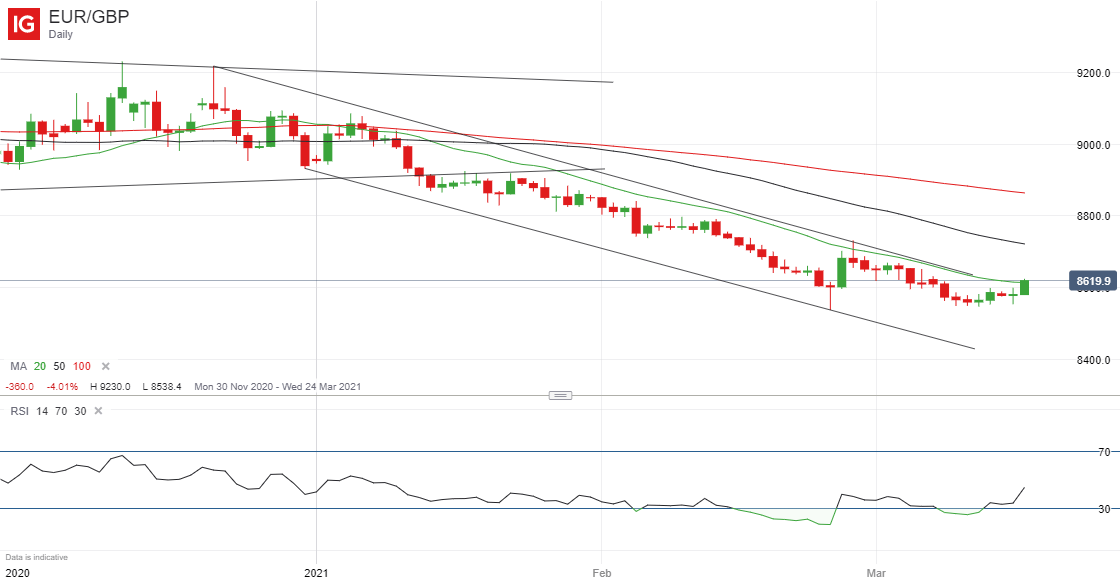
Source: IG
Starts in:
Live now:
Mar 23
( 10:03 GMT )

Recommended by Martin Essex, MSTA
Trading Sentiment
— Written by Martin Essex, Analyst
Feel free to contact me on Twitter @MartinSEssex
|
|
Leave a Reply
You must be logged in to post a comment.