

GBP/USD and EUR/GBP Prices, Charts, and Analysis
Recommended by Nick Cawley
Get Your Free GBP Forecast
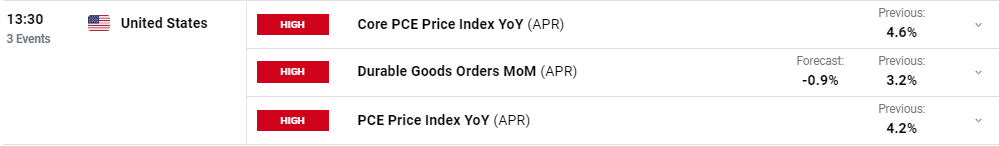
The latest look at UK inflation will determine Sterling’s strength over the coming days and weeks with headline price pressures expected to have fallen sharply in April as elevated energy prices roll off. The headline figure is seen falling to 8.2% from 10.1%, in line with recent comments from BoE Governor Andrew Bailey. The head of the UK central bank said this week that elevated energy prices account for nearly a third of headline inflation and he expects at least two full points to roll off in this week’s report. Inflation reports have been closely watched over the last year or more and this one will be no exception.
May 24, 2023

May 26, 2023
Getting inflation back to the 2% target – BoE Governor Andrew Bailey
While the US and UK inflation reports dominate the economic calendar next week, along with the latest set of PMIs and the FOMC minutes, the ongoing driver of risk sentiment at the moment is the US debt ceiling. Markets turned risk-on earlier in the week after positive commentary between House Speaker McCarthy and President Biden, and in the coming days it looks more likely than not that an agreement will be reached before the US runs out of money.
Debt Ceiling Blues, Part 79. What Happens if the US Defaults?
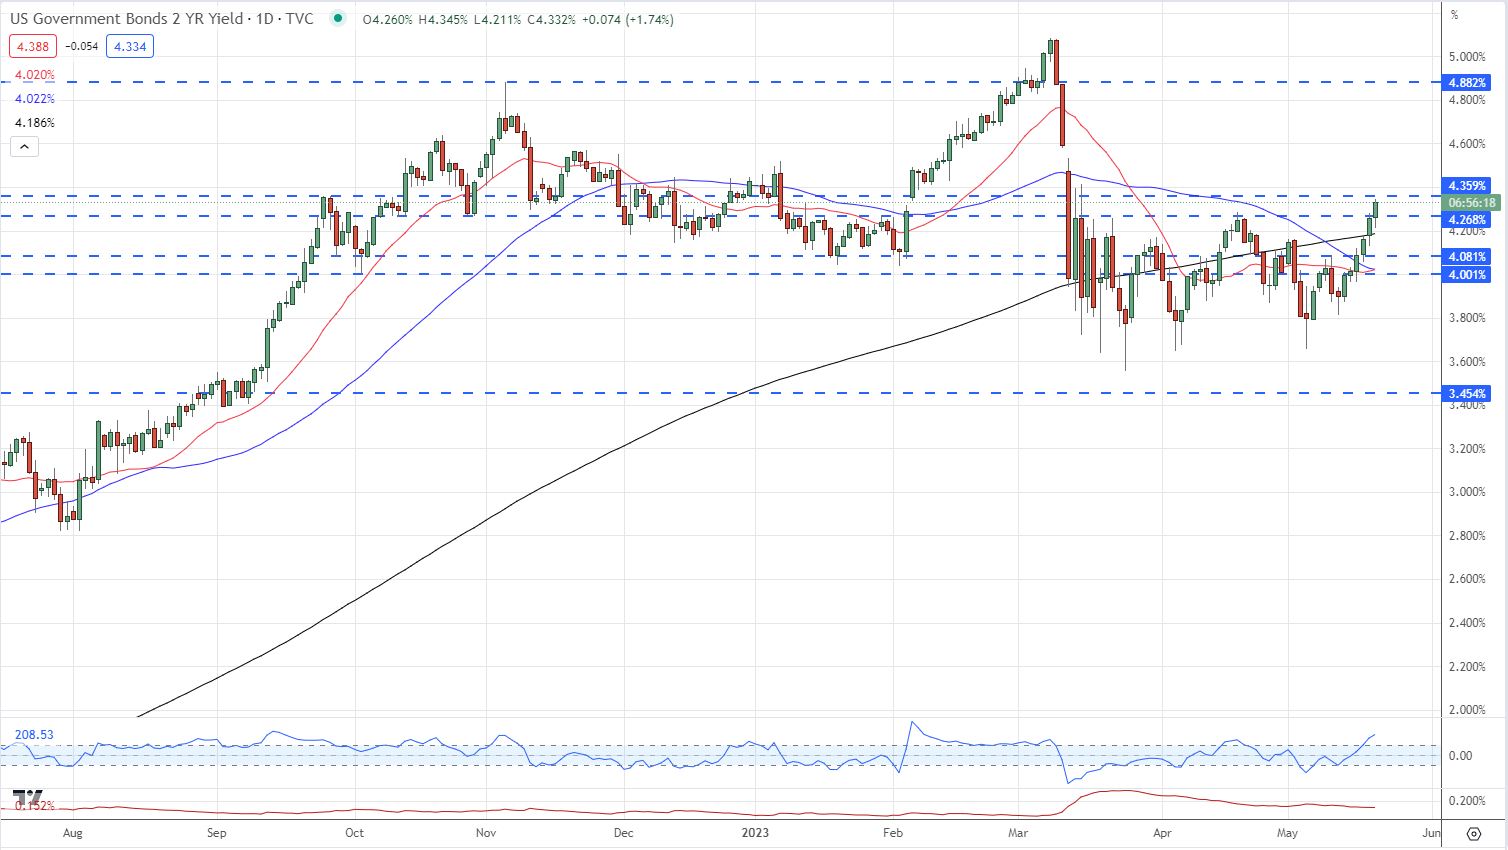
As mentioned earlier, potential progress on the US debt ceiling has boosted risk appetite this week. In addition, hawkish US Fed speak has seen interest rate expectations move with the market starting to price in a rate hike at the June FOMC meeting. This re-pricing has driven US Treasury yields higher, boosting the value of the US dollar.
US Treasury 2-Year Yield – May 19, 2023
Sterling has been relatively stable this week but has been unable to hold its own against a strengthening greenback. Prior support around 1.2447 broke mid-week with the pair making a fresh multi-week low just below 1.2400. There are a few prior lows all the way down to 1.2350 that may slow any further sell-off, but next week’s data, and ongoing US debt ceiling talks, may leave this level vulnerable.
GBP/USD Daily Price Chart – May 19, 2023
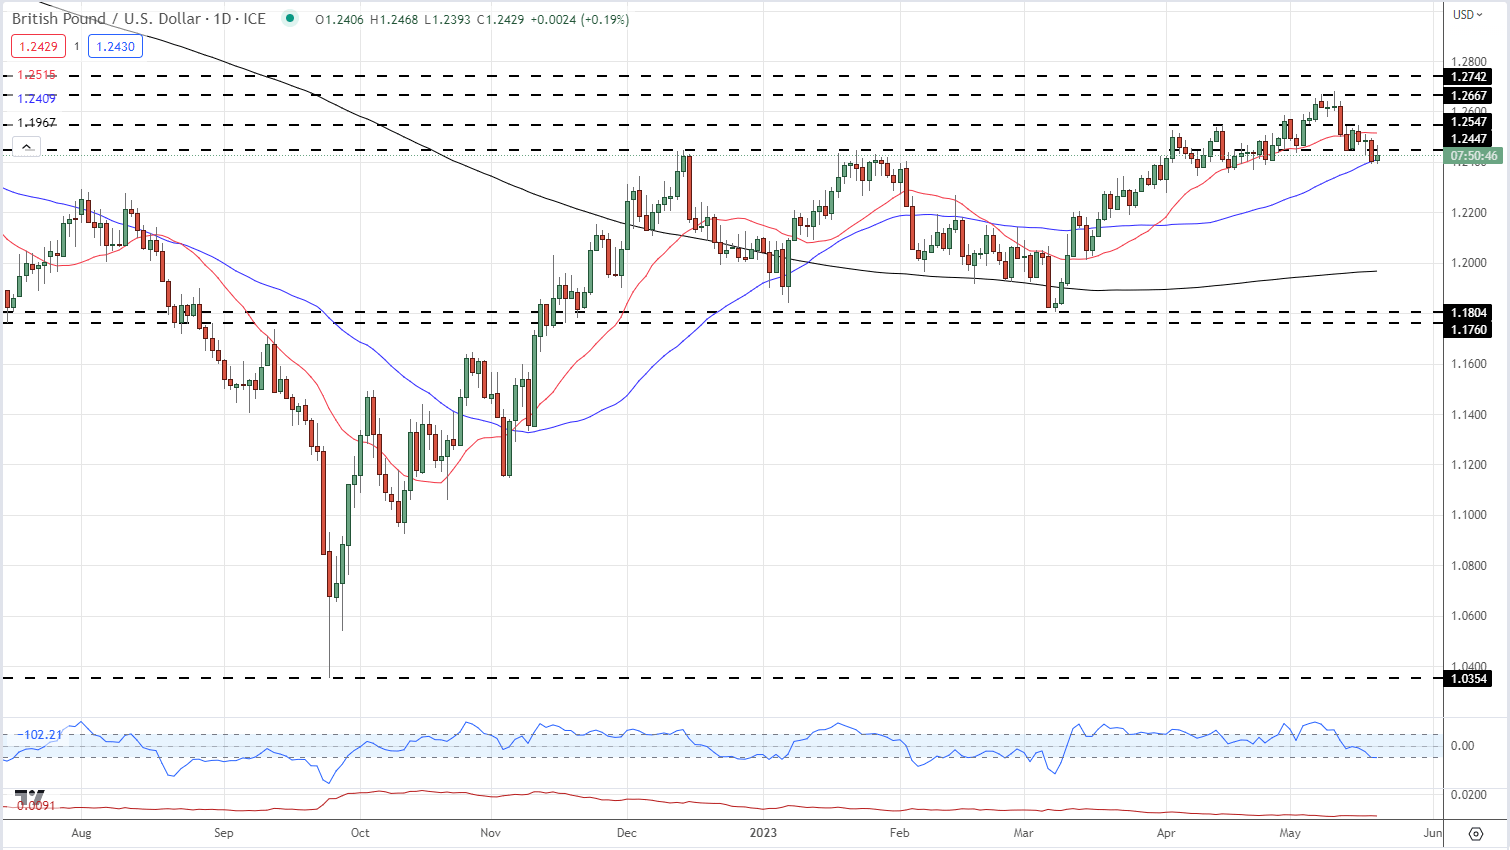
Chart via TradingView
| Change in | Longs | Shorts | OI |
| Daily | -12% | 5% | -5% |
| Weekly | -6% | 3% | -2% |
Retail Traders Increase Their Net-Long Positions
Retail trader data shows 56.31% of traders are net-long with the ratio of traders long to short at 1.29 to 1.The number of traders net-long is 7.49% higher than yesterday and 7.35% higher from last week, while the number of traders net-short is 7.97% lower than yesterday and 9.83% lower from last week.
We typically take a contrarian view to crowd sentiment, and the fact traders are net-long suggests GBP/USD prices may continue to fall. Traders are further net-long than yesterday and last week, and the combination of current sentiment and recent changes gives us a stronger GBP/USD-bearish contrarian trading bias.
What is your view on the GBP/USD – bullish or bearish?? You can let us know via the form at the end of this piece or you can contact the author via Twitter @nickcawley1.
|
|
Leave a Reply
You must be logged in to post a comment.