

GBP/USD – Prices, Charts, and Analysis
- The Bank of England (BoE) looks set to ratchet rates higher next week.
- GBP/USD daily chart looks positive.
Cable is going into the weekend in a fairly upbeat mood and has just printed a fresh one-month high around 1.2245. While Sterling has picked up a small bid over the last two weeks, the driver of the move this week has been a weaker US dollar. The greenback, a one-way trade since June last year, is losing its shine post-FOMC after chair Powell suggested that the Fed may pause rate hikes, when appropriate, the first time this view has been aired. The US dollar has noticeably weakened across the board over the last two days.
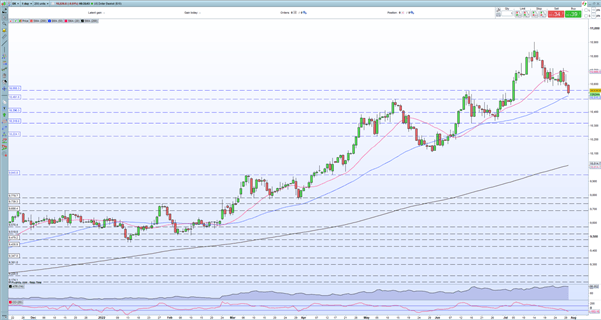
Has the US Dollar (DXY) Topped Out?
For all market-moving economic data and events, refer to the DailyFX calendar
Next week the Bank of England (BoE) will hike the bank rate again with the market now leaning towards a 50 basis point hike. The BoE, along with a swathe of other central banks, is playing catch up with inflation which is expected to hit double-digits in the UK in Q3. The recent monthly GDP data surprised to the upside, printing at +0.5% in May compared to -0.2% in April, while the UK unemployment rate fell to a 50-year low of 3.7% between January and March, according to data from the Office for National Statistics (ONS). This strong backdrop should allow the BoE room to hike rates by half-a-percentage point next Thursday, which in turn will underpin Sterling further.
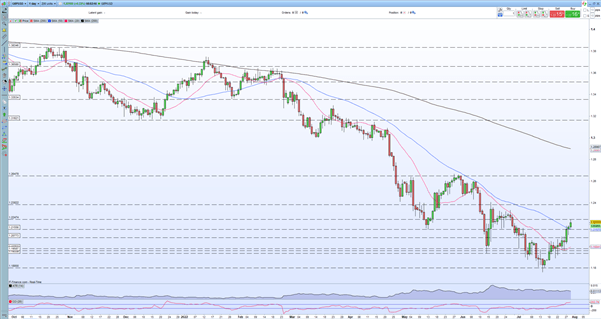
The daily GBP/USD chart remains positive, with a series of higher lows seen since mid-July. A series of higher highs have been broken a couple of times but still suggests a bullish market tone. The pair has also broken above both the 20- and 50-day simple moving averages for the first time since mid-February, and this adds to the positive backdrop. If GBP/USD can keep above 1.2150, then further gains may be seen ahead. Traders should also be mindful of end-of-month fix flows today that may cause sharp, short-term moves.
GBP/USD Daily Price Chart – July 29, 2022
Retail trader data show 65.24% of traders are net-long with the ratio of traders long to short at 1.88 to 1. The number of traders net-long is 3.12% higher than yesterday and 11.30% lower from last week, while the number of traders net-short is 2.41% higher than yesterday and 21.96% higher from last week.
We typically take a contrarian view to crowd sentiment, and the fact traders are net-long suggests GBP/USD prices may continue to fall. Positioning is more net-long than yesterday but less net-long from last week. The combination of current sentiment and recent changes gives us a further mixed GBP/USD trading bias.
What is your view on the British Pound – bullish or bearish?? You can let us know via the form at the end of this piece or you can contact the author via Twitter @nickcawley1.
|
|
Leave a Reply
You must be logged in to post a comment.