

GBP/USD – Prices, Charts, and Analysis
- GBP/USD remains near multi-month high levels.
- US Q4 GDP is the first of two big US economic releases this week.
- Retail trade data underpins a bullish-contrarian bias.
Recommended by Nick Cawley
Forex for Beginners
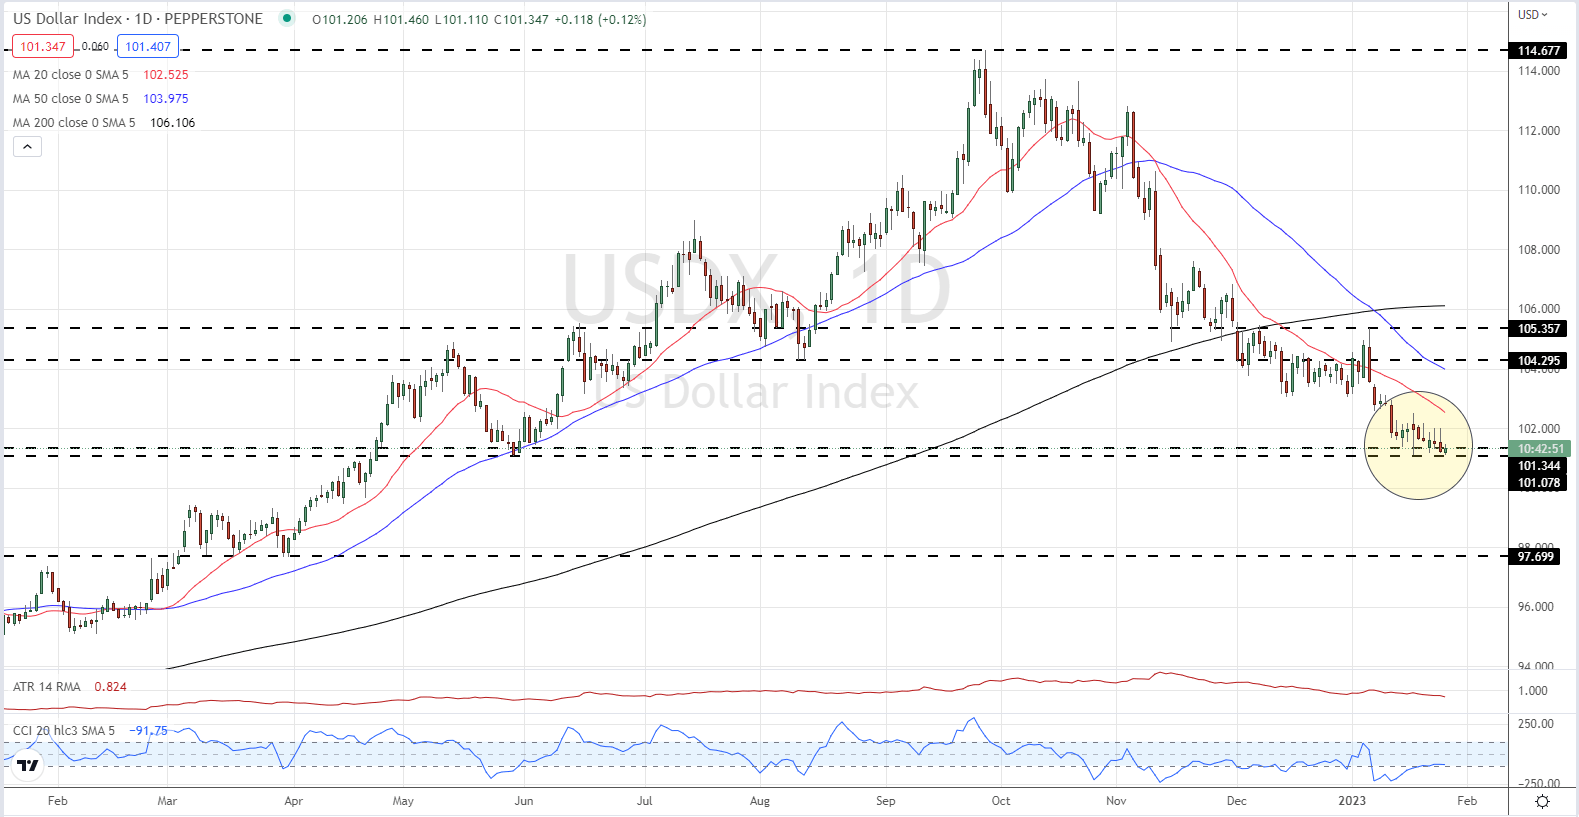
The British Pound is relatively unchanged over the week so far with little in the way of important data to move the dial. Any change in GBP/USD has been driven by US dollar strength or weakness and this is likely to remain the case as two high-importance US economic releases near. Today sees the advanced Q4 GDP numbers released at 13:30GMT, while tomorrow the Fed’s preferred inflation gauge, core PCE, hit the screens at the same time. Both are high-importance data prints and are capable of driving a sizeable move in the US dollar. The US dollar is struggling to stay above a multi-month support level and a break lower could see DXY hit 100 fairly quickly.
US Dollar Index (DXY) – January 26, 2023
For all central bank policy decision dates see the DailyFX Central Bank Calendar
Recommended by Nick Cawley
Get Your Free GBP Forecast
The British Pound is treading water ahead of next week’s Bank of England (BoE) rate decision. The UK central bank is expected to raise the base rate by 50 basis points – a 71% probability according to the latest market pricing – from 3.50% to 4.00%, leaving borrowing costs stuck at their highest level in 15 years.
GBP/USD is struggling to break through a zone of resistance on either side of 1.2450 as the US dollar sits on multi-month support. Cable has tried and failed, repeatedly, to break through this zone of resistance and will need a solid driver to make the next move. A confirmed break higher would leave the late-June high at 1.2667 as the next level of interest, while a turn lower would see 1.2260-1.2280 come into play.
GBP/USD Daily Price Chart – January 26, 2023
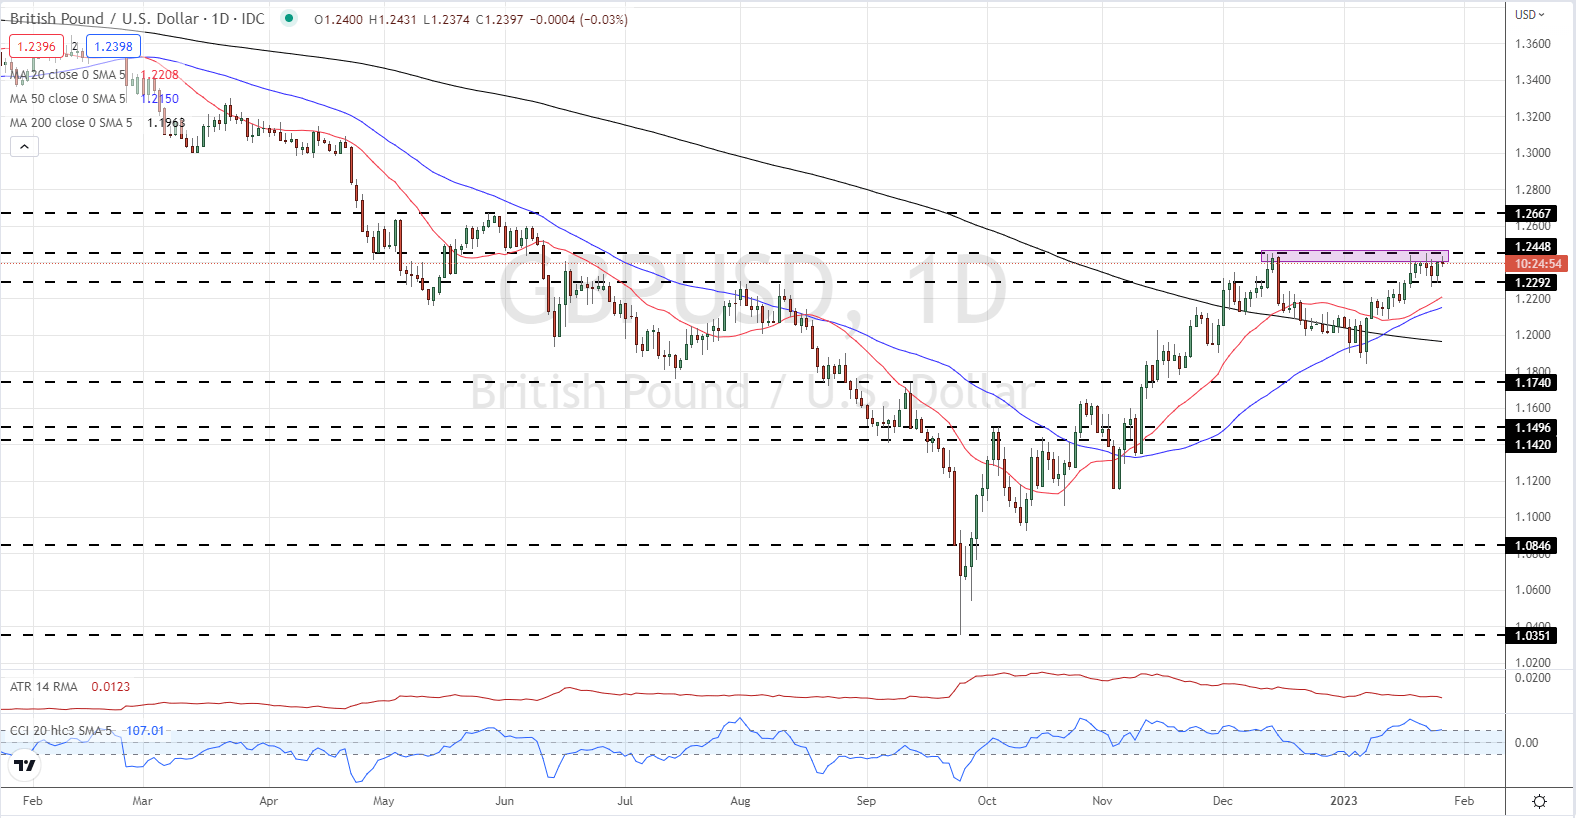
Charts via TradingView
| Change in | Longs | Shorts | OI |
| Daily | -13% | 4% | -3% |
| Weekly | -7% | 7% | 1% |
Retail Trader Bias Remains Bullish
Retail trader data show 37.04% of traders are net-long with the ratio of traders short to long at 1.70 to 1.The number of traders net-long is 14.94% lower than yesterday and 4.96% lower from last week, while the number of traders net-short is 8.34% higher than yesterday and 9.42% higher from last week.
We typically take a contrarian view to crowd sentiment, and the fact traders are net-short suggests GBP/USD prices may continue to rise. Traders are further net-short than yesterday and last week, and the combination of current sentiment and recent changes gives us a stronger GBP/USD-bullish contrarian trading bias.
What is your view on the British Pound – bullish or bearish?? You can let us know via the form at the end of this piece or you can contact the author via Twitter @nickcawley1.
|
|
Leave a Reply
You must be logged in to post a comment.