Canadian Dollar Price Analysis:
Canadian Dollar Remains in Range, for Now
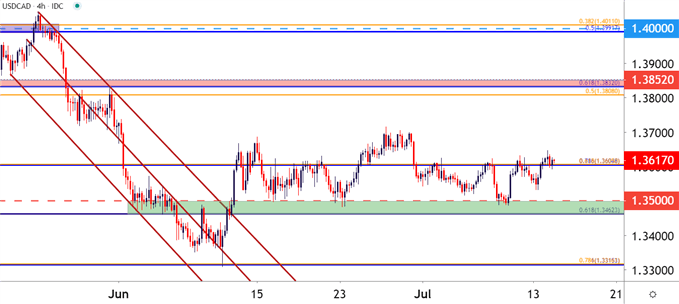
The range in USD/CAD is now a month-old, and this comes on the heels of a rather decisive sell-off that saw price action in the pair fall by more than 700 pips in just a few weeks. This syncs up with a similar sell-off in the USD; but USD/CAD soon found support at the 1.3315 support area and sellers went on pause shortly after. That support bump saw prices push up to 1.3600 and then 1.3700; and this was followed by mean reversion that’s lasted through the Q2 close and into the first two weeks of Q3 trade.
USD/CAD Four-Hour Price Chart
Chart prepared by James Stanley; USDCAD on Tradingview
USD/CAD Bigger Picture
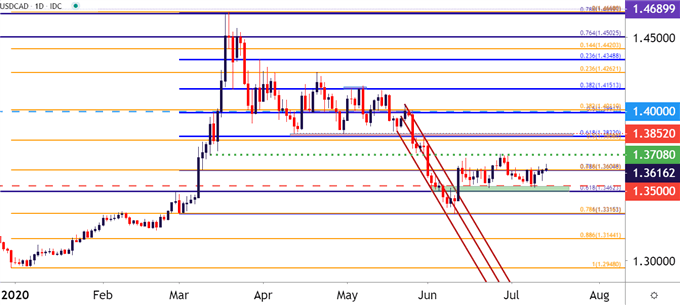
Taking a step back to longer-term charts, and context becomes key. The first two-and-a-half months of 2020 trade were very friendly to USD/CAD bulls, as the pair jumped by more than 1,700 pips from the 2020 low up to the mid-March high. But – buyers pulled up just shy of a re-test at the 17-year high, and what started as a pullback soon turned into a reversal, and prices slalomed all the way down to the 1.3315 support area.


Recommended by James Stanley
Building Confidence in Trading
Since then we’ve largely been range-bound in USD/CAD, but the aggression of the early-2020 run followed by the outsized reversal helps to set the stage for what might be next when this range finally gives way, in one direction or the other.
USD/CAD Daily Price Chart
Chart prepared by James Stanley; USDCAD on Tradingview
USD/CAD Short-Term Dynamics – Possible Range Test Towards 1.3700
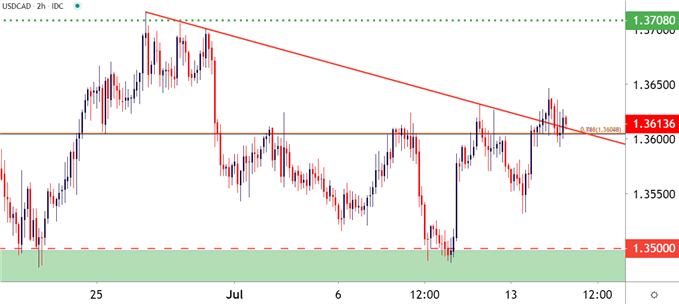
At this point, USD/CAD remains mired in the month-long range and there’s little to suggest that may soon change. There may, however, be some potential within the range, as the 1.3600 zone, which is confluent with a couple of different Fibonacci levels and has previously offered some short-term resistance, is currently coming into play as short-term support.
| Change in | Longs | Shorts | OI |
| Daily | -6% | -20% | -12% |
| Weekly | -4% | -1% | -3% |
This could possibly keep the door open for short-term bullish themes, looking for prices to push up towards intermediate-term range resistance, taken from around that 1.3700 handle. The below two-hour price chart highlights a trendline projection that was prior resistance, now coming in as potential support.
USD/CAD Two-Hour Price Chart
Chart prepared by James Stanley; USDCAD on Tradingview
— Written by James Stanley, Strategist for DailyFX.com
Contact and follow James on Twitter: @JStanleyFX
|
|


Leave a Reply
You must be logged in to post a comment.