

Crude Oil Price Talking Points
The price of oil halts a three-day selloff despite a larger-than-expected rise in US inventories, and crude may continue to hold above the 50-Day SMA ($87.58) as a bull-flag formation appears to be taking shape.
Advertisement
Crude Oil Price Forecast: Bull Flag Formation Takes Shape
Recent price action in crude raises the scope for a larger pullback as it extends the series of lower highs and lows from earlier this week, but the recent decision by the Organization of Petroleum Exporting Countries (OPEC) may keep oil prices afloat as the group plans to “adjust downward the overall production by 2 mb/d” starting in November.”
As a result, the price of oil may attempt to retrace the decline from the monthly high ($93.64) as long as it holds above the moving average, and it remains to be seen if OPEC will take additional steps to prop up crude prices as data prints coming out of the US warn of slowing consumption.
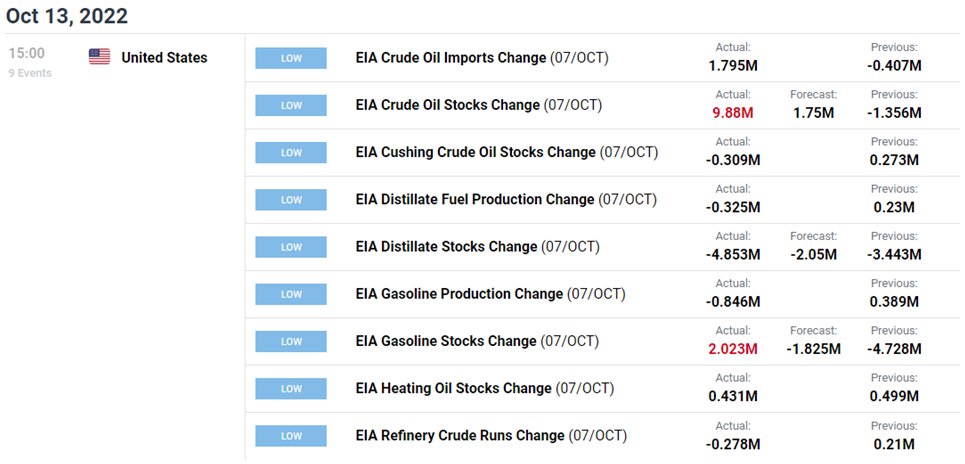
Fresh figures from the Energy Information Administration (EIA) show crude inventories climbing 9.88M in the week ending October 7 versus forecasts for a 1.75M rise, and signs of waning demand may push OPEC to further adjust its production a schedule as the most recent Monthly Oil Market Report (MOMR) reveals that “world oil demand growth in 2022 is revised down by 0.5 mb/d.”

The MOMR goes onto say that “for 2023, world oil demand growth is also revised down to stand at 2.3 mb/d,” and it remains to be seen if OPEC will continue to curb production at the next Ministerial Meeting on December 4 as rising interest rates across advanced economies dampens the outlook for energy consumption.
Until then, developments coming out of the US may sway oil prices as a deeper look at the EIA report shows a decline in the weekly field production of crude, with the figure narrowing to 11,900K in the week ending October 7 from 12,000K the week prior.
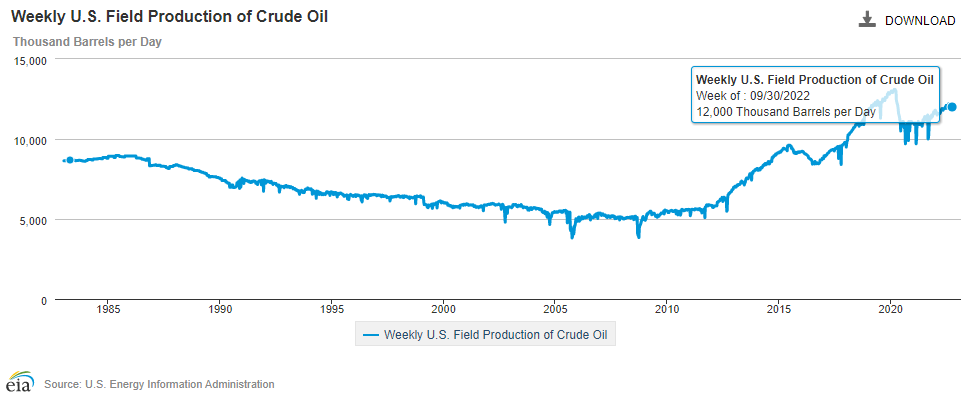
In turn, current conditions may prop up oil prices as US output slips to its lowest level since July, and the price of crude may no longer respond to the negative slope in the 50-Day SMA ($87.58) as market participants brace for a shift in OPEC production.
With that said, the recovery from the September low ($76.25) may turn out to be a key reversal in the price of oil as it holds above the January low ($74.27), and crude may attempt to retrace the decline from the monthly high ($93.64) as a bull-flag formation takes shape.
Crude Oil Price Daily Chart

Source: Trading View
- The price of oil trades to a fresh weekly low ($85.56) as it continues to carve a series of lower highs and lows, and lack of momentum to hold above the 50-Day SMA ($87.58) may push crude towards the $84.20 (78.6% expansion) to $84.60 (78.6% expansion) area, with a break of the monthly low ($80.87) opening up the $78.50 (61.8% expansion) to $79.80 (61.8% expansion) region.
- However, a bull-flag formation appears to be taking shape as crude manages to hold above the moving average, with a break/close above the 90.60 (100% expansion) to $91.60 (100% expansion) region bringing the monthly high ($93.64) on the radar.
- A break/close above the Fibonacci overlap around $93.50 (61.8% retracement) to $95.30 (23.6% expansion) may push the price of oil towards the 200-Day SMA ($97.29), with the next region of interest coming in around $100.20 (38.2% expansion).
Trading Strategies and Risk Management
Becoming a Better Trader
Recommended by David Song
— Written by David Song, Currency Strategist
Follow me on Twitter at @DavidJSong
|
|
Leave a Reply
You must be logged in to post a comment.