

DAX 30 & FTSE 100 Price Outlook:
DAX 30 & FTSE 100 Wedge Breaks Look Imminent, Catalyst Required
The DAX 30 and FTSE 100 have worked themselves into similar technical patterns over the last few weeks as both indices find themselves near the lower-bound of a rising wedge formation. Rising wedge patterns are generally viewed as bearish technical formations and, if the textbook example occurs, conclude by a breakout to the downside through the lower bound. Thus, the presence of such a formation on the European indices could suggest potential declines in the days ahead.
DAX 30 Technical Forecast
While the formation is typically viewed as an ominous one, there is cause for encouragement on the DAX 30 price chart. Most notably, the DAX 30 has recently established a series of new all-time highs which could suggest an eventual wedge break may serve as healthy consolidation before the next move higher rather than a rally-breaking reversal.
DAX 30 Price Chart: 4 – Hour Time Frame (March 2021 – June 2021)
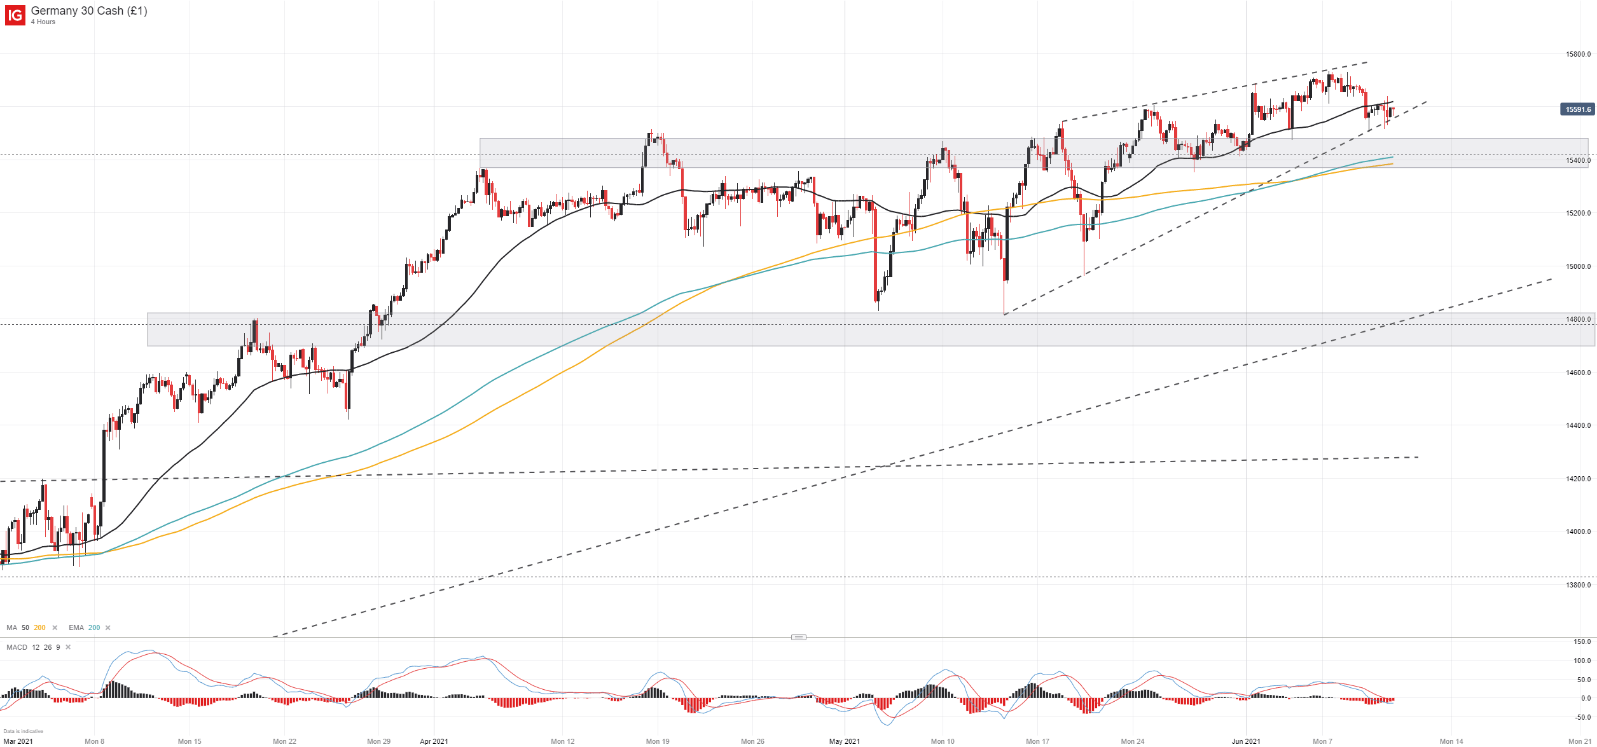
A bearish breakdown would see the DAX 30 test prior resistance around the 15,400 mark and a breach through secondary support may lead to range-bound price action for the German equity index.
How to Short Sell a Stock When Trading Falling Markets
FTSE 100 Technical Forecast
The FTSE 100 finds itself in a similar position, albeit over a much longer timeframe which could suggest a deeper retracement should bearishness occur. Unlike the DAX 30, the FTSE has yet to establish a new all-time high in the pattern, or in the post-pandemic era, which highlights the relative weakness of the index.
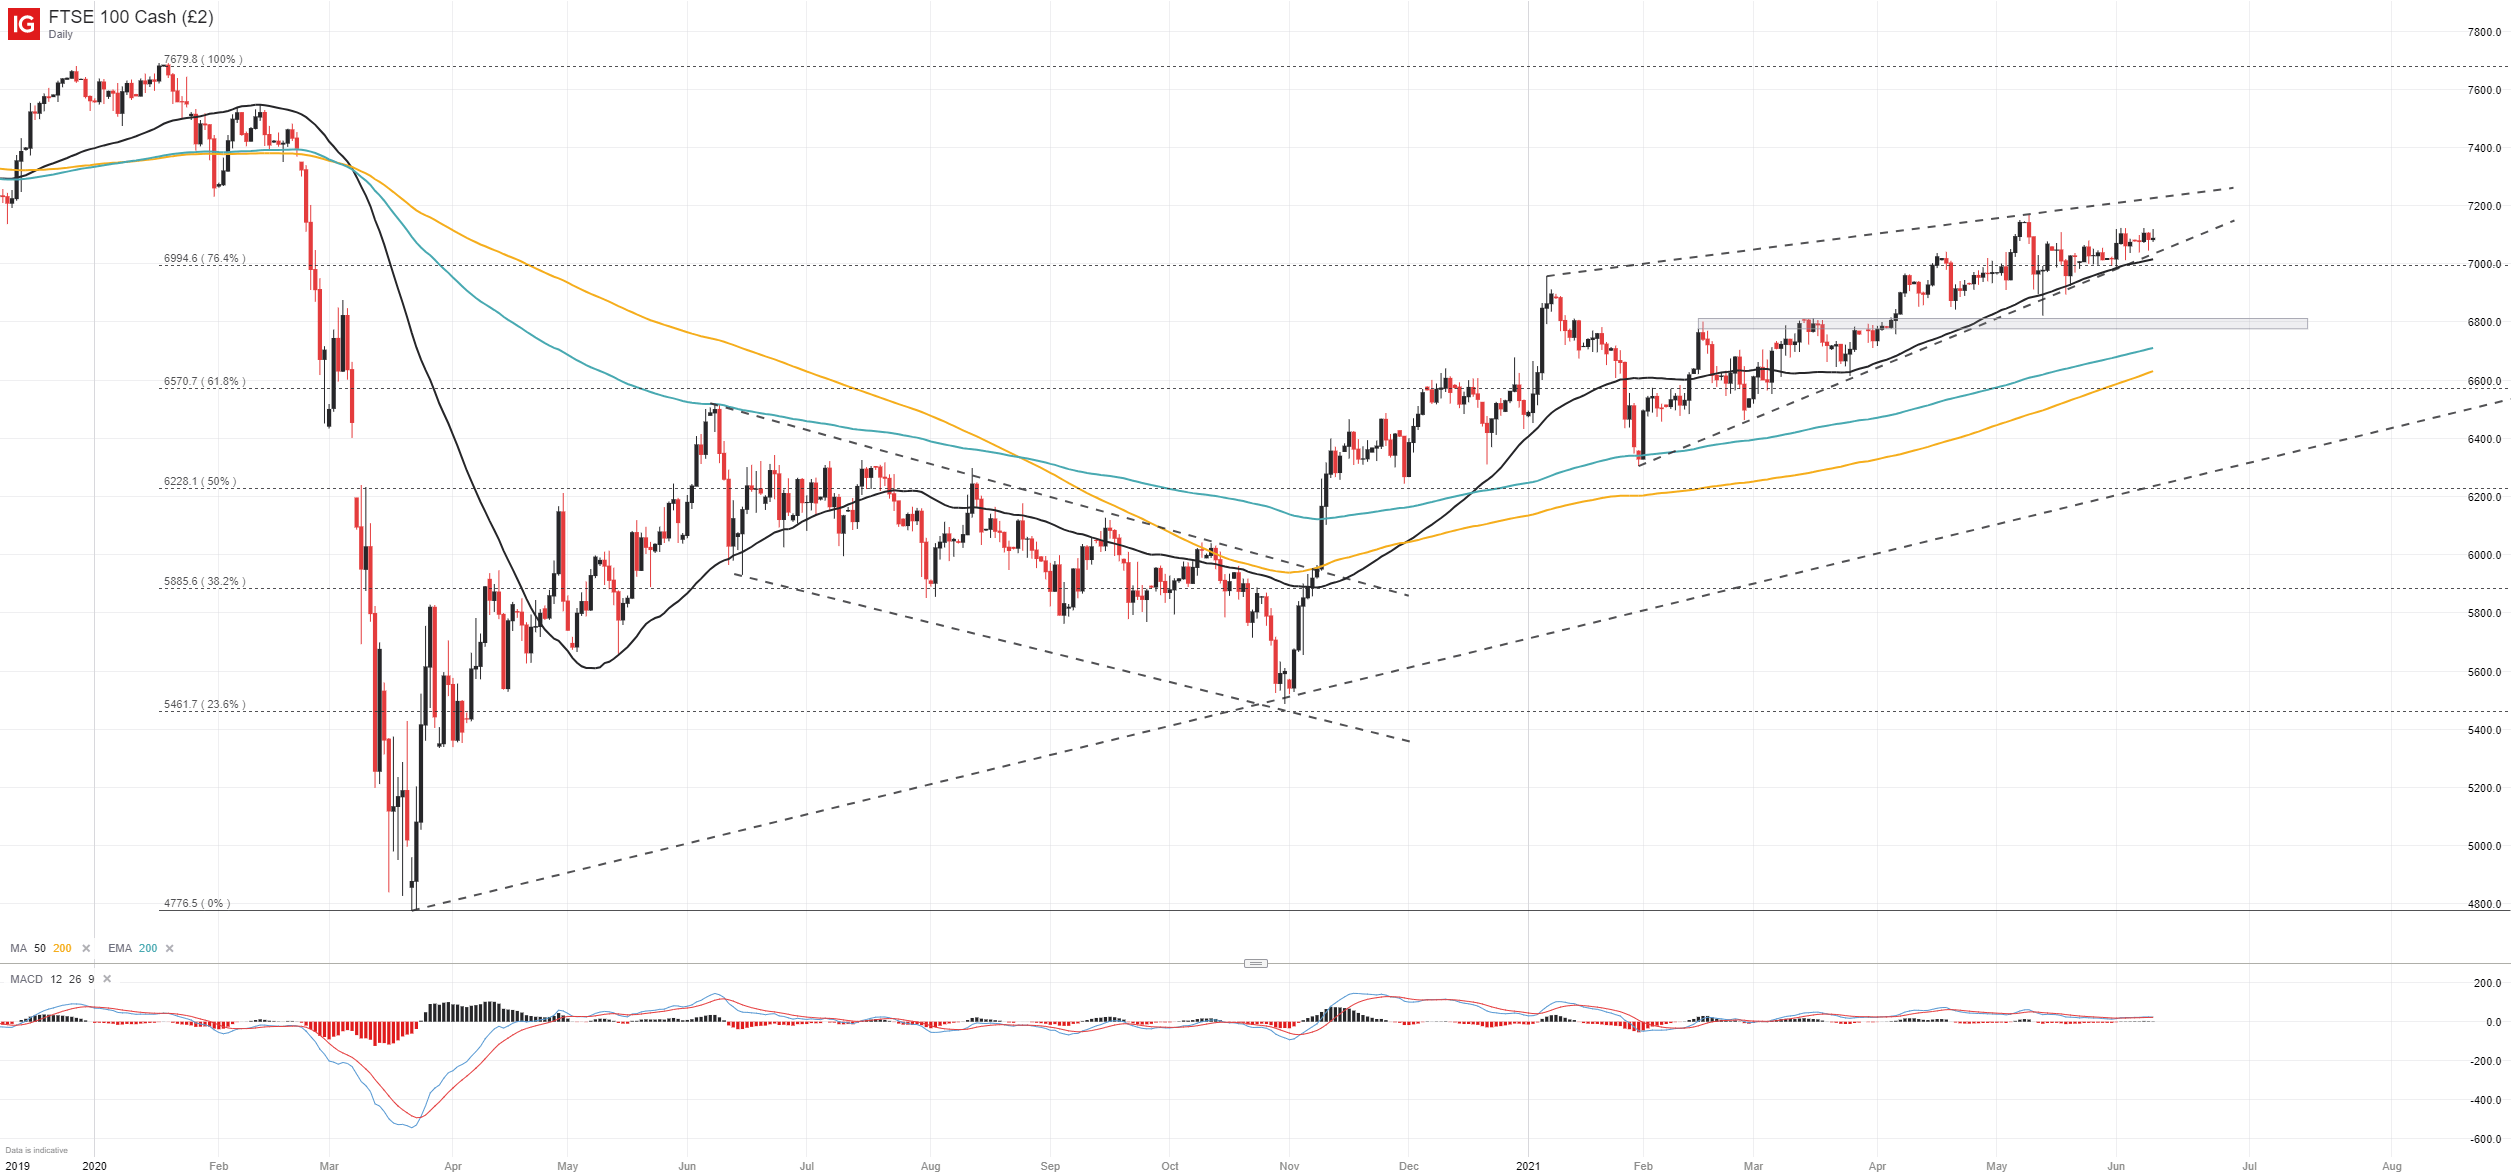
Thankfully for bulls, the FTSE 100 enjoys nearby support in the form of a Fibonacci level and the 50-day simple moving average. Both technical levels conveniently coincide with the lower-bound of the rising wedge which trades just north of 7,000. A breakdown could see the FTSE 100 seek initial support around the 6,800 mark.
FTSE 100 Price Chart: Daily Time Frame (December 2019 – June 2021)
While both the DAX 30 and FTSE 100 trade within ominous technical patterns, the textbook resolution to these patterns does require an eventual breakdown – an event that requires a catalyst and conviction to provide follow-through.
With that in mind, the likelihood a minor break of necessity is posted – rather than an explosive volatility event – in either or both of the indices is heightened given current market conditions. Volume and volatility have all but dried up and economic data releases seem to have lost their ability to conjure up market activity. Nevertheless, the patterns warrant attention as a sudden revival in volatility could see price action accelerate. In the meantime, follow @PeterHanksFX on Twitter for updates and analysis.
–Written by Peter Hanks, Strategist for DailyFX.com
Contact and follow Peter on Twitter @PeterHanksFX
|
|
Leave a Reply
You must be logged in to post a comment.