

Dow, Nasdaq 100, Hang Seng Charts and Analysis
Article by IG Chief Market Analyst Chris Beauchamp
Recommended by IG
Building Confidence in Trading
Dow in full retreat on debt ceiling worries
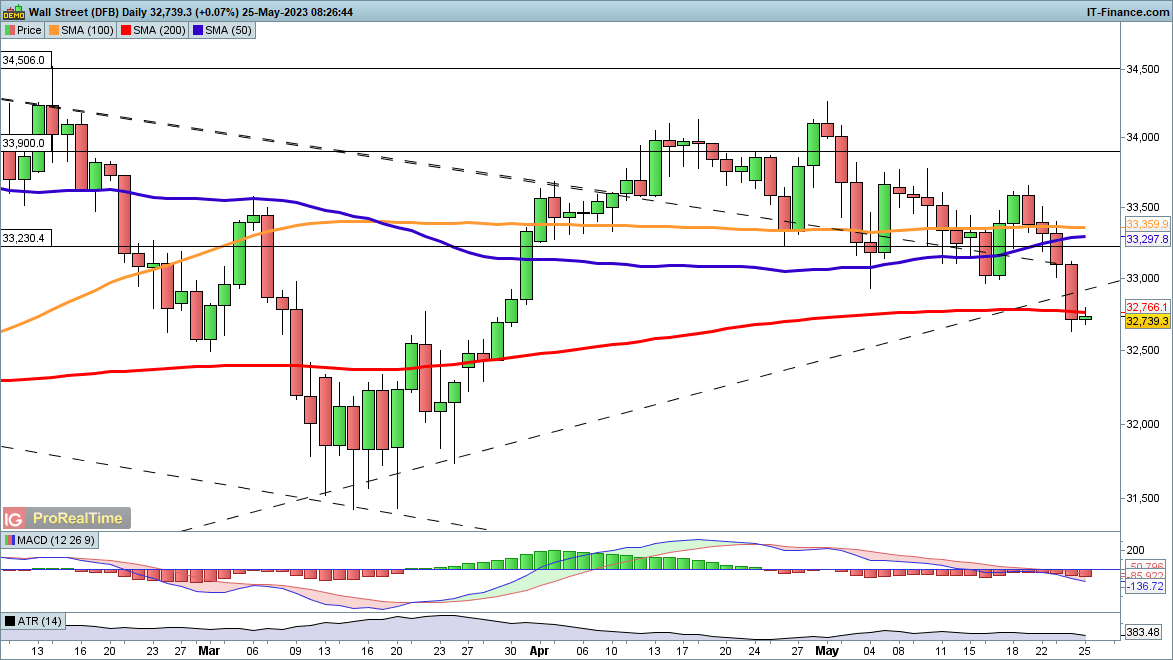
?The past four days have seen the index slump 900 points, falling below the 50-day SMA on Tuesday and the 200-day SMA on Wednesday.
? ?The price also finds itself below trendline support from the September/October lows. Notably during the March pullback it did not close below this line, so yesterday’s drop is a significant development.
? ?Further declines would now target the March lows down towards 31,500. Bulls will need a recovery back above 33,000 to see the price back above trendline support and suggest that a higher low has been formed.
Dow Daily Price Chart
Trade Smarter – Sign up for the DailyFX Newsletter
Receive timely and compelling market commentary from the DailyFX team
Subscribe to Newsletter
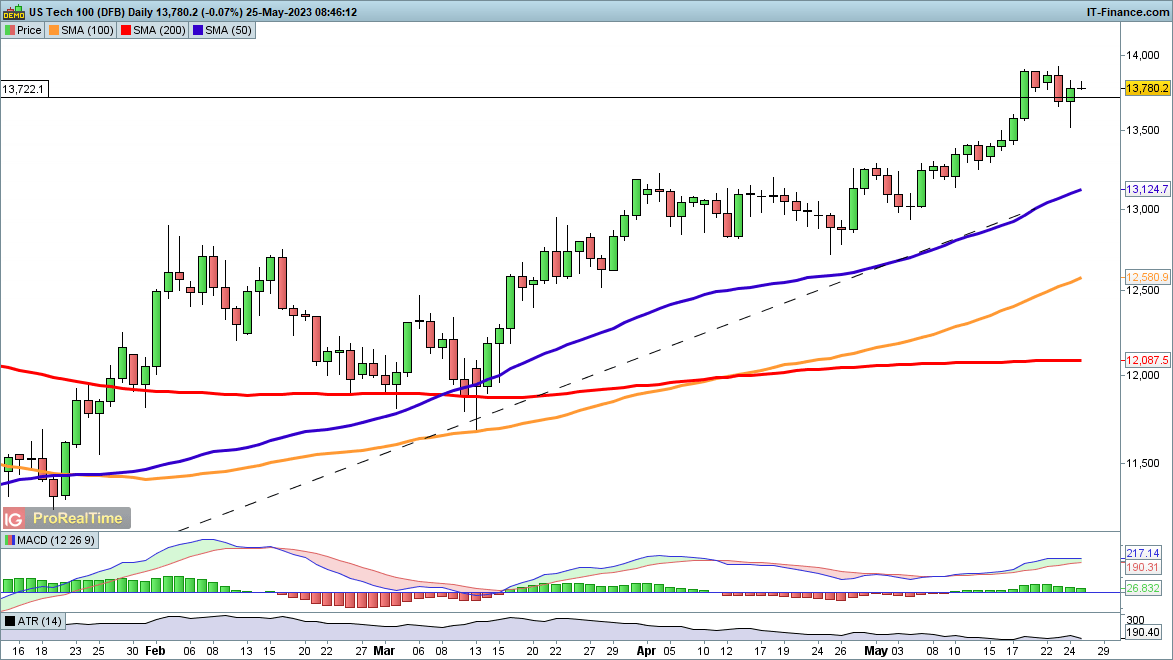
?Nasdaq 100 bolstered by Nvidia
?Nvidia’s results provided the fuel for a bounce yesterday that saw the index reverse all its losses.
? ?The resilience of the index when set against the backdrop of the US debt crisis is quite remarkable, and yesterday’s revival cancels out, for the time being, any expectation that the index will join in the risk-off move across US indices.
?A move back below 13,500 would open the way to the 50-day SMA and rising trendline support from the January lows. Fresh upside targets 14,300 from mid-April.
Nasdaq 100 Daily Price Chart
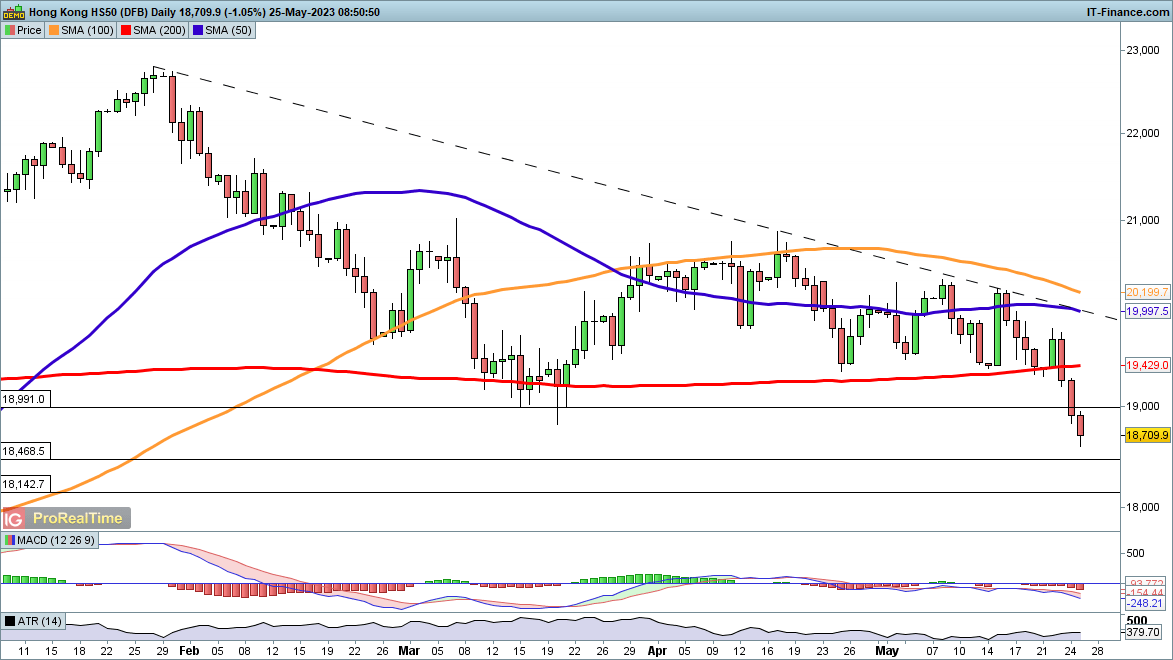
?Hang Seng hits seven-month low
?Three days of losses have seen the index move to its lowest level since late November.
? ?The price has slumped below the 200-day SMA, and now it looks like a test of the mid-November 18,460 level is in the offing, while below this the 18,142 peak from early October would be the next target.
? ?A rebound might target the 200-day SMA and then trendline resistance from the February high.
Hang Seng Daily Price Chart
Recommended by IG
The Fundamentals of Trend Trading
|
|
Leave a Reply
You must be logged in to post a comment.