

Dow Jones Industrial Average, Nasdaq 100, Volatility and Event Risk Talking Points:
- The Market Perspective: Dow Range 34,600 to 38,200
- Equities begrudgingly advanced in the past US session, leading the Dow to a five-day advance that still fits comfortably within its broad range
- The Nasdaq 100’s 2.0 percent rally pushed the index above its 200-day simple moving average for the first time in 203 trading days – ending the longest slump in two decades
Recommended by John Kicklighter
Get Your Free Equities Forecast
The US equity market is not progressing very far, but the benchmark indices are still making progress. Setting aside the S&P 500 which already cleared its congestion resistance, the Dow Jones Industrial Average and Nasdaq 100 are on the opposite sides of progress compared to that most-heavily traded measure (among derivatives). For the blue-chip Dow, we modest 0.6 percent advance may notch an impressive consistency, but it remains firmly within the range formed these past two months. Alternatively, the tech-heavy Nasdaq, which is comparatively trading at a heavy discount to its peers’ recovery, managed to achieve a significant technical milestone through Thursday’s 2 percent climb. Which one of these measures is more indicative of what the market is positioned to accomplish?
Taking a closer look at the Dow’s performance, we could dress up the statistics in different ways. For the enthusiastic bull, the market has climbed five consecutive sessions and is closest to restoring the glory of fresh record highs (approximately 8 percent from the January 2022 peak. Seen a different way, that five-day performance amounted to a modest 2.7 percent climb; and the Thursday close sits firmly in the middle of the 34,700 to 32,600 range formed over the past two months. For many traders simply seeking out volatility in all its forms, that may cool interest or focus attention elsewhere. However, if the markets are more prone to range conditions rather than trend/momentum; this would actually seem a more suitable backdrop.
Chart of the Dow with 100 and 200-Day SMAs, Consecutive Candle and 5-Day ATR (Daily)
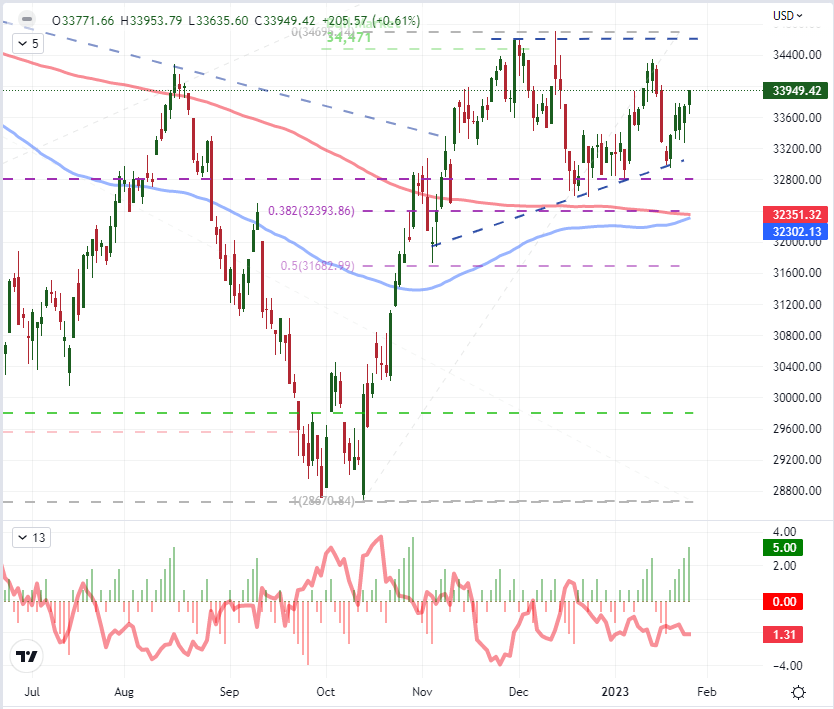
Chart Created on Tradingview Platform
In contrast to the contained activity of the Dow, the Nasdaq 100’s own charge managed to earn a serious technical achievement. The index had already cleared the dominant trendline guiding the bear market through 2022 at the start of the week. This past session managed to recharge a dithering bullish interest – turning former resistance to new support – and subsequently clear the 200-day simple moving average. Among technical indicators that are monitored across the investing spectrum, the 200-day SMA is perhaps the most recognized (even the physical paper-reading fundamentalists seem to be aware). It is remarkable that we are crossing this threshold as it is the first close above in 203 trading days. Notably, that brings to a close the longest stretch for the market trading below that long-term average in 20 years (the period encompassing the aftermath of the Dot-com bust). This looks like an extraordinary event, but are win the kind of market that can project what this development implies?
Chart of Nasdaq 100 with 100 and 200-Day SMAs, 200-Day Disparity Index (Daily)
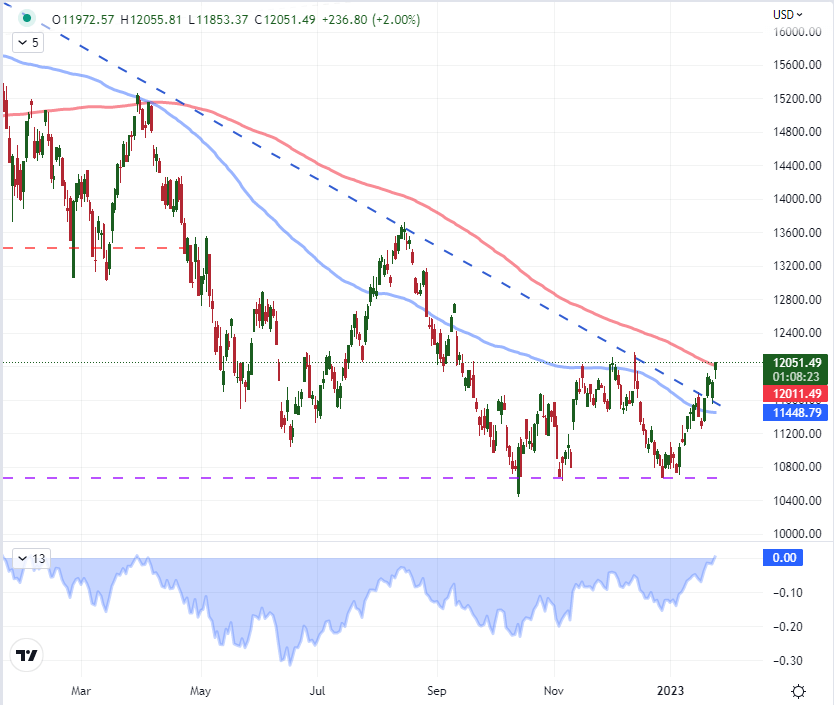
Chart Created on Tradingview Platform
There has been some choppy progress in pulling out of last year’s technical bear trend, but conviction has been noticeably absent with each point of progress. With a backdrop of higher interest rates, persistent inflation and constant warnings of recession; the foundation for a restorative bull market is not easily made. The ‘complacency bid’ of the past decade is no longer reliable given the central banks’ commitment to taming inflation rather than encouraging marginal acceleration in growth. Taking a different tack on evaluating risk appetite, there is some internal value that I find in the comparison between the Nasdaq and Dow. The ratio between the two reached a peak comparable to the Dot-com boom high back in November 2021. The retracement in this appetite for relative ‘growth’ (versus ‘value) extended all the way to the 38.2 percent Fib retracement of the 2002 to 2021 recovery. Since the December/January lull, we have slowly began to recovery the appetite for higher return stocks. While I don’t put must stock into the nuanced technicals of this ratio, we seem to have returned to something of a decision point as to how much conviction the market is really willing to afford the markets.
Chart of Nasdaq 100 to Dow Jones Industrial Average Ratio with 100 and 200-Day SMAs (Daily)
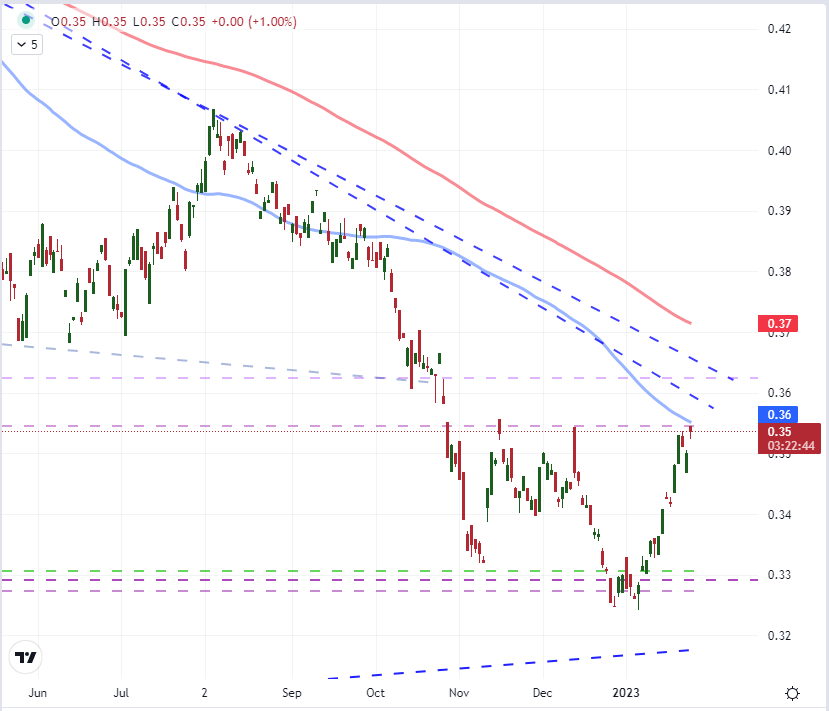
Chart Created on Tradingview Platform
As we await the market’s technical commitment and contemplate the unfavorable attitude of the fundamental backdrop, there is a conditional element that may do more to dictate interim activity – at least until the middle of next week. There is a lot of event risk on the docket moving forward. When the markets are struggling to find a source of conviction, there is a greater susceptibility to anticipation. Something like Friday’s PCE deflator (the Fed’s favorite inflation indicator) will readily be overridden by the definitiveness of the FOMC rate decision Wednesday. Meanwhile, a progression of the IMF’s World Economic Outlook, house prices, Conference Board consumer sentiment survey (Tuesday), ISM manufacturing report (Wednesday), top tech earnings (Thursday) and NFPs and ISM services report (Friday) make for a long list of events that could theoretically alter the outlook with a significant surprise.
Chart of Top US Based Event Risk for Next Week
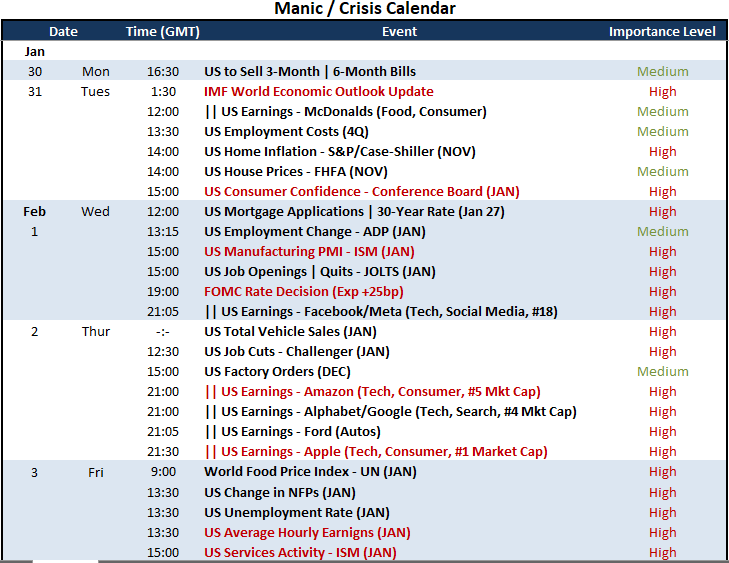
Calendar Made by John Kicklighter
|
|
Leave a Reply
You must be logged in to post a comment.