

DOW JONES, NIKKEI 225, ASX 200 INDEX OUTLOOK:
- US equity futures rebounded after suffering a tech-led pullback in last-hour trading
- Asia-Pacific stocks edged higher on reflation hopes at open
- Biden proposed a US$1.9 trillion Covid-relief plan that include stimulus checks and funds to fight the pandemic

Recommended by Margaret Yang, CFA
Get Your Free Equities Forecast
Dow Jones, Biden’s Relief Package, Jobless Claims, Asia-Pacific at Open:
Federal Reserve Chairman Jerome Powell reiterated the Fed’s dovish stance in a webcast last night, suggesting that the central bank will keep its QE in place for at least 2021 and maintain interest rates unchanged through 2023. Against this backdrop, market focus shifted to Biden’s announcement of a US$ 1.9 trillion Covid-relief proposal, which may include US$ 1 trillion in direct relief to households, US$ 415 billion to assist vaccine rollout and US$ 440 billion to support small businesses and communities. Additional stimulus checks of US$ 1,400 on top of the already-approved $ 600 payment to individuals are part of the plan too.
Another round of stimulus plans raised reflation hopes and led the Treasury yield curve higher. The 10-, 20- and 30- year Treasury yields advanced 4-5bps overnight, weighing on precious metal prices include gold and silver. On the other hand, crude oil, copper, nickel and iron ore prices have advanced on brightening demand outlook, which appears more than to offset the impact of rising yields. The US Dollar is trading mutedly this morning.
Australia’s ASX 200 index opened higher, led by information technology (+1.52%), energy (+1.35%) and materials (+0.80%) sector, while utilities (-0.78%) and consumer discretionary (-0.63%) trailed. Japan’s Nikkei 225 advanced 0.3% at open, extending its rally to hit fresh three-decade high.
On the macro front, a higher-than-expected US initial weekly jobless claims number hints at further weakness in the labor market as the pandemic wave hits, underpinning the urgent need for Covid-relief aid. Jobless claims came in at 965k in the week ending January 8th, marking its highest level since August 2020. The market anticipated a lower print of 795k. Chinese exports and imports in December have both beaten market expectations from the upside, registering YoY growth of 18.1% and 6.5% respectively. This pointed to still strong overseas demand for manufacturing goods and may provide fundamental support to the Chinese Yuan.
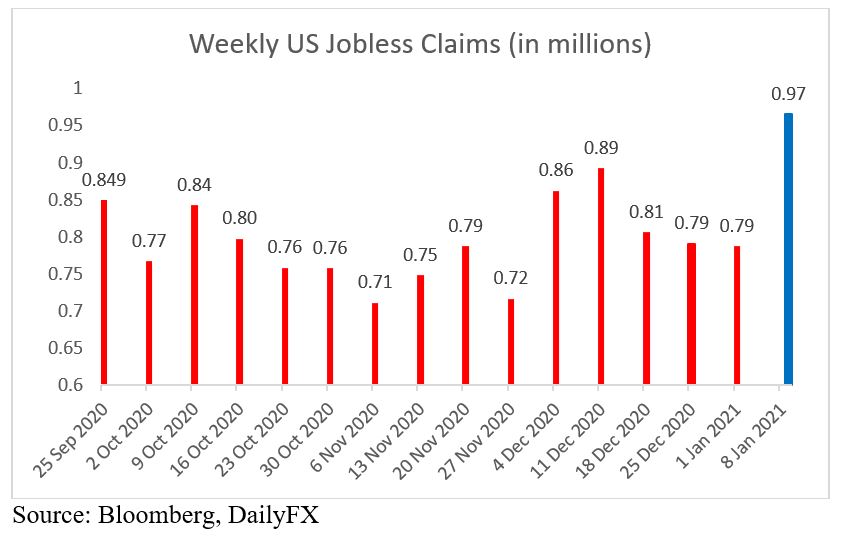
Source: Bloomberg, DailyFX
Sectoral patterns were pretty mixed overnight, 4 out of 9 Dow Jones sectors ended higher, with 46.7% of the index’s constituents closing in the green on Thursday. Energy (+2.40%), financials (+1.02%) and industrials (+0.76%) were among the best performers, whereas consumer discretionary (-1.75%) and communication services (-1.16%) were trailing.
Dow Jones Sector Performance 14-01-2021
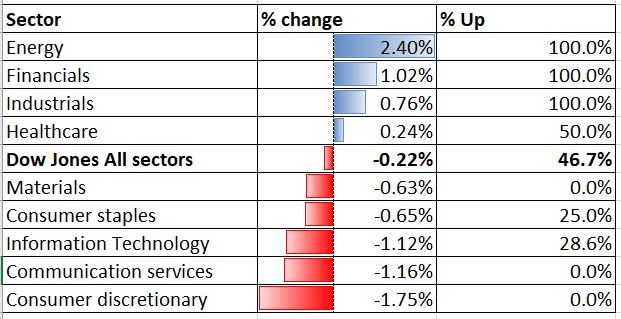
Source: Bloomberg, DailyFX
Starts in:
Live now:
Jan 18
( 13:01 GMT )

Learn about trading global equities
Weekly Scalping Webinar
Dow Jones Index Technical Analysis
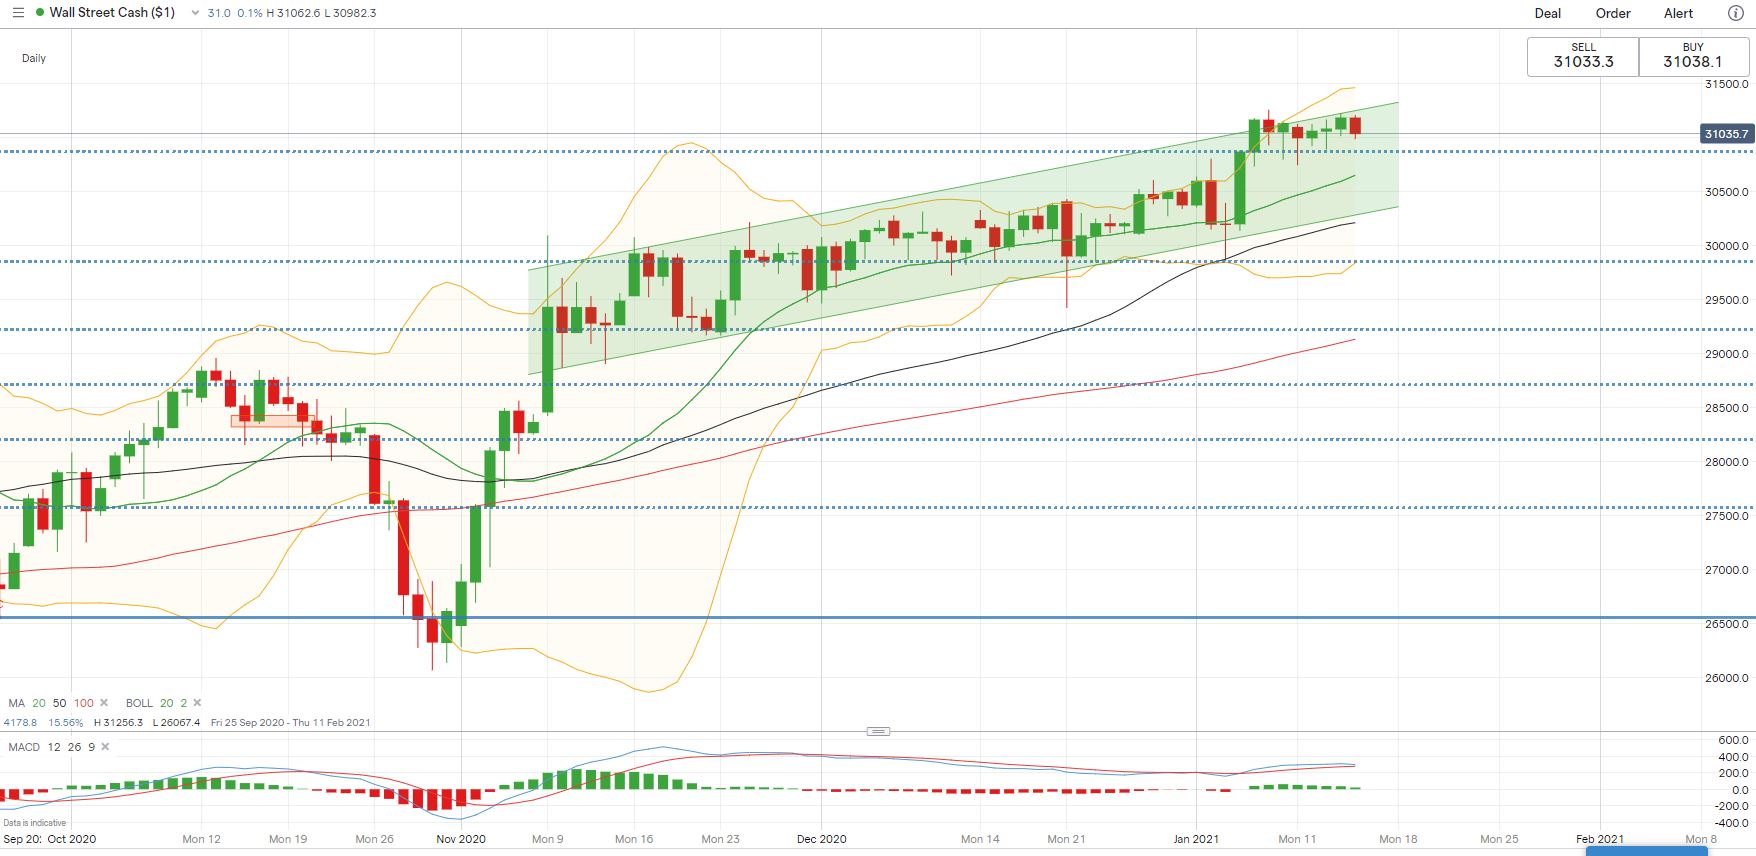
The Dow Jones indexis hitting the upper ceiling of an “Ascending Channel” and may face some selling pressure here. The price broke above a key resistance level of 30,870 (the 100% Fibonacci extension) last week and thus has opened the door for further upside potential. The overall trend remains bullish-biased, although a minor pullback towards the 100% Fibonacci level is likely before attempting higher highs.
Dow Jones Index – Daily Chart
Nikkei 225 Index Technical Analysis:
The Nikkei 225 index is challenging a key chart resistance at 28,770 – the 100% Fibonacci extension level – with strong upward momentum. The overall trend remains bullish-biased as suggested by upward-sloped 20-, 50- and 100-Day Simple Moving Average (SMA) lines. Breaking 28,770 may open the door for further upside potential with an eye on 29,680 – the 127.2% Fibonacci extension.
Nikkei 225 Index – Daily Chart

ASX 200 Index Technical Analysis:
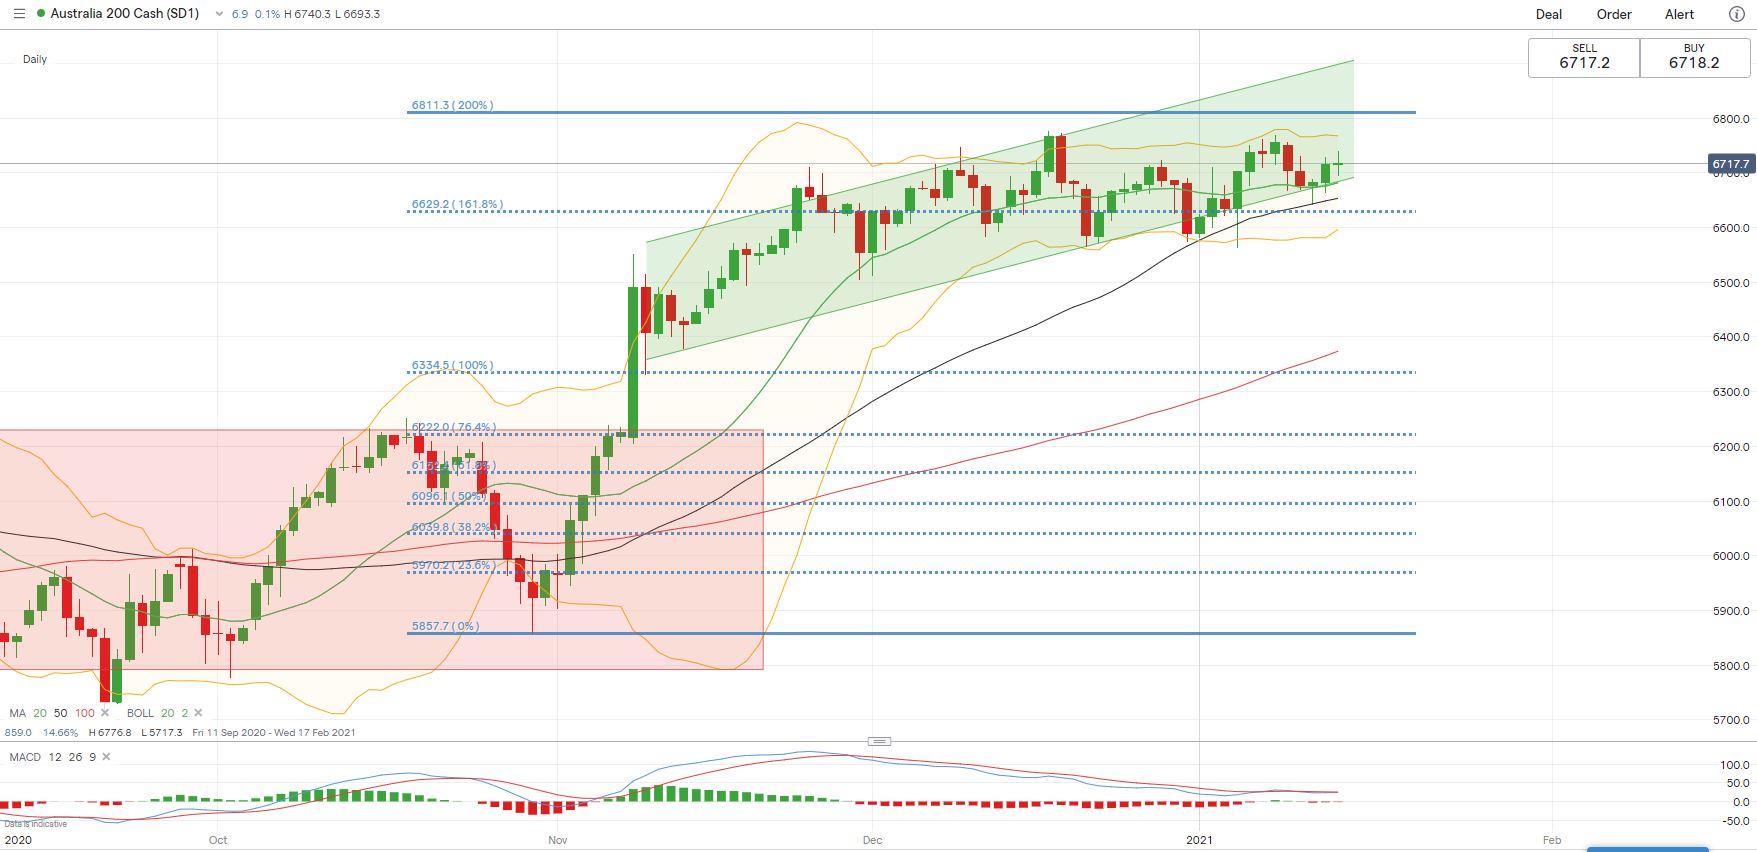
The ASX 200 index remains within its “Ascending Channel” as highlighted on the chart below, but upward momentum appears to be faltering as the MACD indicator trends lower. An immediate support level can be found at 6,630 – the 161.8% Fibonacci extension level. A firm break down below this level may open the door for further losses. An immediate resistance level can be found at 6,760 – the upper Bollinger band.
ASX 200 Index – Daily Chart

Recommended by Margaret Yang, CFA
Improve your trading with IG Client Sentiment Data
— Written by Margaret Yang, Strategist for DailyFX.com
To contact Margaret, use the Comments section below or @margaretyjy on Twitter
|
|
Leave a Reply
You must be logged in to post a comment.