

EUR/GBP Analysis:
- EUR/GBP failed to test the June high and has bounced off the psychological 0.9000 level
- The pair suffered losses following the conclusion of the EU recovery fund deal and surging UK public borrowing figures
- Sentiment data shows that roughly 58% of traders are net-short, with an influx of long traders entering the market over the last 24 hours
EUR/GBP Moves Lower After Failed Retest of June Highs
After the July 13 bullish advance, the pair had shown signs of buyer exhaustion via multiple long upper wicks in the candle formation leading up to the June high of 0.9176. Long upper wicks tend to suggest that there is a rejection of higher prices at those levels taking place. This observation is further supported when there are multiple candles exhibiting long upper wicks, as there were from 14 – 20 July.
The move lower comes after a deal was agreed upon by EU leaders regarding the recovery fund and despite worse than expected UK public-sector borrowing figures.
EUR/GBP Daily Price Chart

Chart prepared by Richard Snow, IG
EUR/GBP Strategy Moving Forward
The daily chart below highlights the significant area of support for EUR/GBP (orange rectangle). This area represents an area of confluence as the psychological 0.9000 level almost overlaps with the 38.2% fib level to form a support zone. A close below the 0.9000 and 0.8988 levels could see price action move towards the recent swing low at 0.8940.
A late resurgence, after the close of the London trading session had seen bulls push price action up off the 0.9000 level. Bullish traders that may view this as the start of another upswing will be eying the 0.9139 level and should bullish momentum persist from there, possibly even a retest of the June high of 0.9176.
Starts in:
Live now:
Jul 28
( 17:07 GMT )

Get greater insight into price action in this webinar
Trading Price Action
EUR/GBP Daily Chart Showing Key Trading Levels
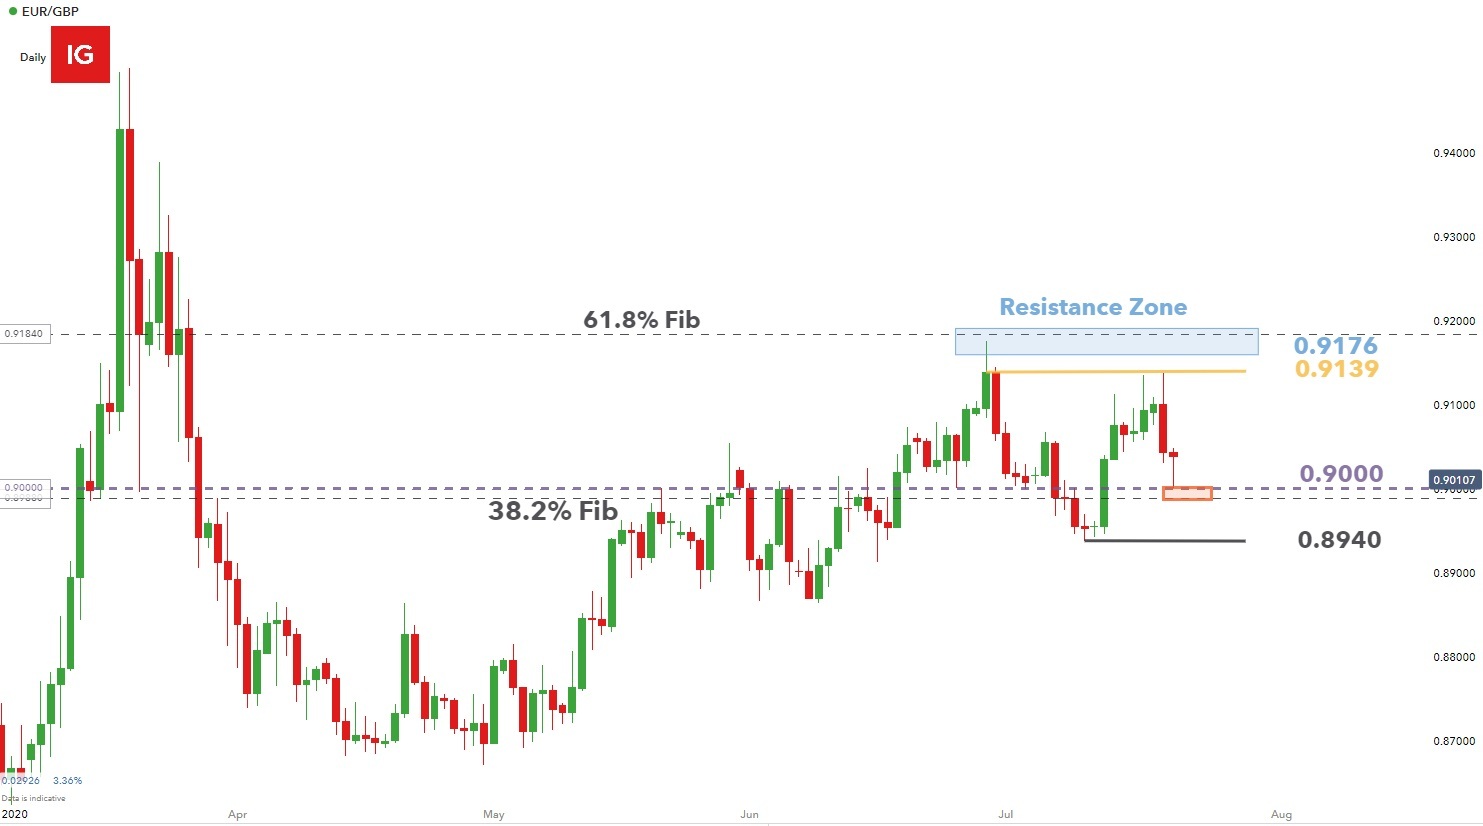
Chart prepared by Richard Snow, IG
EUR/GBP Sentiment: IG Trader Positioning
- At the time of writing, retail trader data shows 58% of EUR/GBP traders are net-short with the ratio of traders short to long at 1.38 to 1.
- The number of traders net-long is 24.79% higher than yesterday and 10.33% higher from last week, while the number of traders net-short is 10.09% lower than yesterday and 3.95% higher from last week.
| Change in | Longs | Shorts | OI |
| Daily | 20% | -8% | 4% |
| Weekly | 64% | -25% | 3% |
- When operating with a contrarian view with respect to crowd sentiment, considering that traders are net-short would suggests EUR/GBP prices may continue to rise.
- Yet traders are less net-short than yesterday and compared with last week. Recent changes in sentiment warn that the current EUR/GBP price trend may soon reverse lower despite the fact traders remain net-short.
— Written by Richard Snow for DailyFX.com
Contact and follow Richard on Twitter: @RichardSnowFX
|
|
Leave a Reply
You must be logged in to post a comment.