

EUR/USD Price Forecast:
EUR/USD: All Eyes on Jackson Hole
After recovering from March 2020 lows, bulls trading EUR/USD dominated the market, with an impressive nine week rally, until coming into a wall of resistance at the psychological level of 1.200 and the US Dollar was able to regain a portion of its recent losses.
Visit the DailyFX Educational Center to learn about psychological levels and more
Although the FOMC minutes revealed that the Fed has no intention of tampering with rates in the near future, concerns surrounding the ballooning balance sheet and yield curve control remain. This draws our attention to the much anticipated Jackson Hole Economic Symposium, where Fed Chairman Jerome Powell will review the framework for monetary policy today at 13:10 GMT, which will likely set the tone for September.
Meanwhile, a resurgence of Covid-19 related cases in Europe, particularly in Spain, Italy and France, have once again confirmed that the pandemic is not yet over, diminishing hopes of a swift economic recovery.
Price Action Stalls at Key Fibonacci Support
After four consecutive months of gains, the EUR/USD has stumbled into a key level of Fibonacci retracement, diminishing the hopes of a bullish continuation.
From a technical standpoint, the weekly chart below highlights Fibonacci levels from two major moves. The first Fibonacci retracement (pink) represents the move between the April 2014 high and the January 2017 low, while the second Fibonacci (purple) represents the short-term move, plotted between the February 2018 high and the March 2020 low.
Currently, the 61.8% retracement level continues to hold strong at a level of 1.18244, in anticipation of today’s economic event. In addition to this, the Relative Strength Index (RSI), is hovering around 70, a possible indication that the pair may be approaching overbought territory.

Recommended by Tammy Da Costa
How can news impact your trades?
EUR/USD Weekly Chart
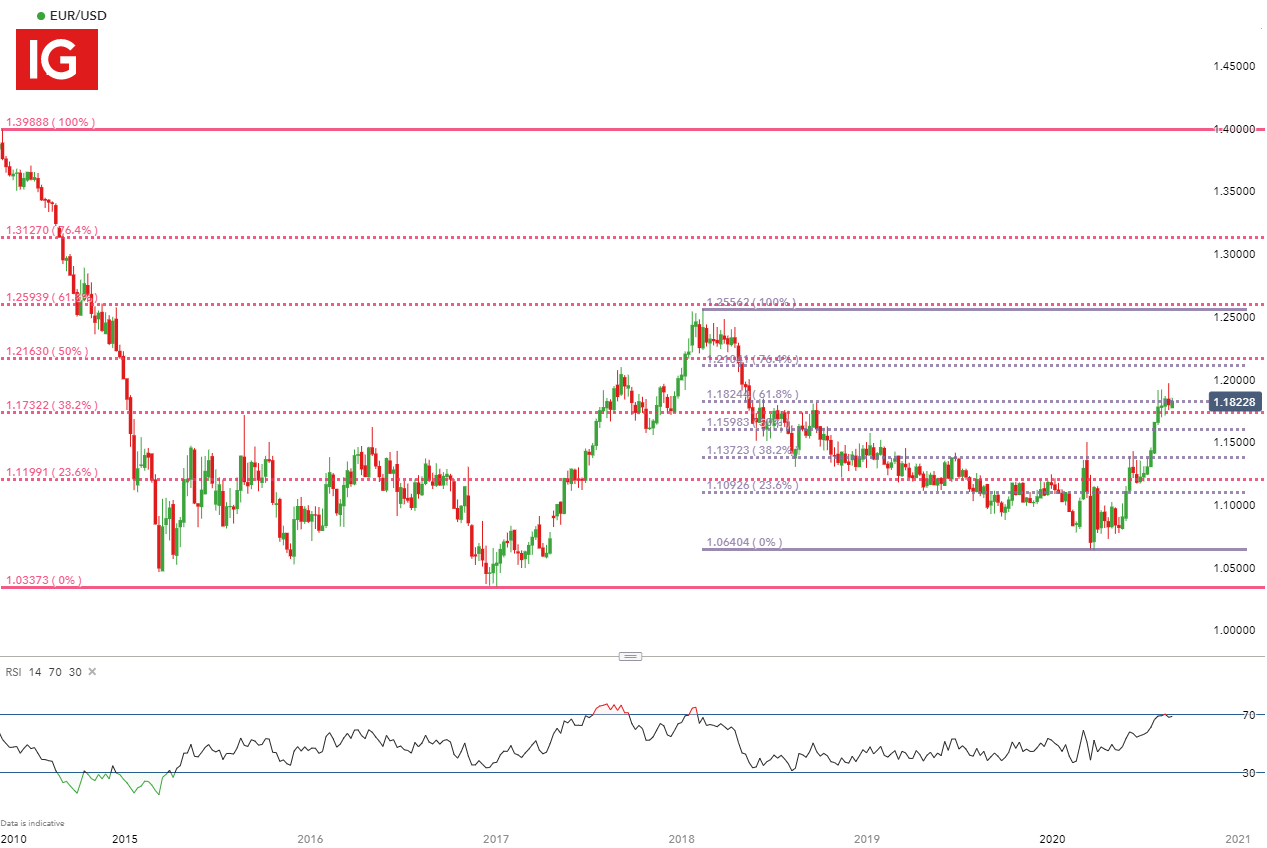
Chart prepared by Tammy Da Costa, IG
EUR/USD Falls Below 55- Period MA
From a short-term view, the four-hour chart below highlights that the EUR/USD has fallen below the 55-period moving average (MA), another possible indication that the bulls are struggling to maintain control.
The area of confluency formed by the 31.8% retracement of the long-term move (1.17307) and the 61.8% retracement level mentioned above, are holding strong as support, but a break below may provide confirmation that the trend may soon reverse.
Starts in:
Live now:
Sep 01
( 17:09 GMT )

James Stanley’s Webinar for US Dollar Price Action
Trading Price Action
EUR/USD 4 Hour Chart

Chart prepared by Tammy Da Costa, IG
Client Sentiment

Recommended by Tammy Da Costa
How does sentiment affect the market?
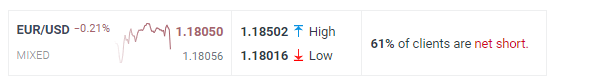
IGCS shows that, at the time of writing, EUR/USD client sentiment remains bearish, with 61% of retail traders holding short positions. We typically take a contrarian view to crowd sentiment and the fact that clients are net short, suggests that prices may continue to rise
— Written by Tammy Da Costa, Market Writer for DailyFX.com
Contact and follow Tammy on Twitter: @Tams707
|
|
Leave a Reply
You must be logged in to post a comment.