

EUR/USD AND EUR/JPY FORECAST:
- EUR/USD remains stuck in a horizontal channel, but a breakout could be around the corner
- EUR/JPY probes key Fibonacci resistance
- Important technical levels to watch on the euro in the near term
Most Read: S&P 500, Nasdaq 100, Dow Jones – Grinding into Key Resistance
EUR/USD TECHNICAL ANALYSIS
After a sharp sell-off earlier this year, the euro has stabilized against the U.S. dollar in recent weeks, but has been unable to mount a significant recovery amid a lack of positive fundamentals. In this regard, the Europe’s energy crisis, regional economic weakness, and the ECB’s reluctance to hike rates aggressively have created headwinds for the common currency, limiting its upside performance against the greenback. In fact, after bouncing off its 2022 lows and back above parity, EUR/USD has moved mostly sideways, as shown in the chart below, trapped within a horizontal channel, with its lower boundary at ~1.0100 and its upper boundary near ~1.0280.
In general, range trading activity points to indecision, a situation where neither buyers nor sellers are in control. While directionless markets can be boring for traders who prefer more volatility, they can sometimes lead to explosive moves once key levels are invalidated. This can create interesting opportunities for breakout strategies, a technique that aims to take advantage of possible continuation after prices move out of defined areas of support or resistance, provided the breakout is accompanied by higher than usual volume.
In the case of EUR/USD, there are two main zones to watch in the short term: resistance at 1.0280 and support at 1.0100. If the pair decisively pierces the 1.0280 barrier, upside momentum could accelerate, paving the way for a rally towards a descending trendline extended off the February highs, passing by 1.0375 at the time of this writing. On further strength, the focus shifts to 1.0480. On the bearish side, if consolidation resolves to the downside, with the exchange rate breaching the 1.0100 floor in daily closing prices, sellers could regain control of the market, triggering a drop towards the 2022 lows at 0.9952.
EURUSD TECHNICAL CHART
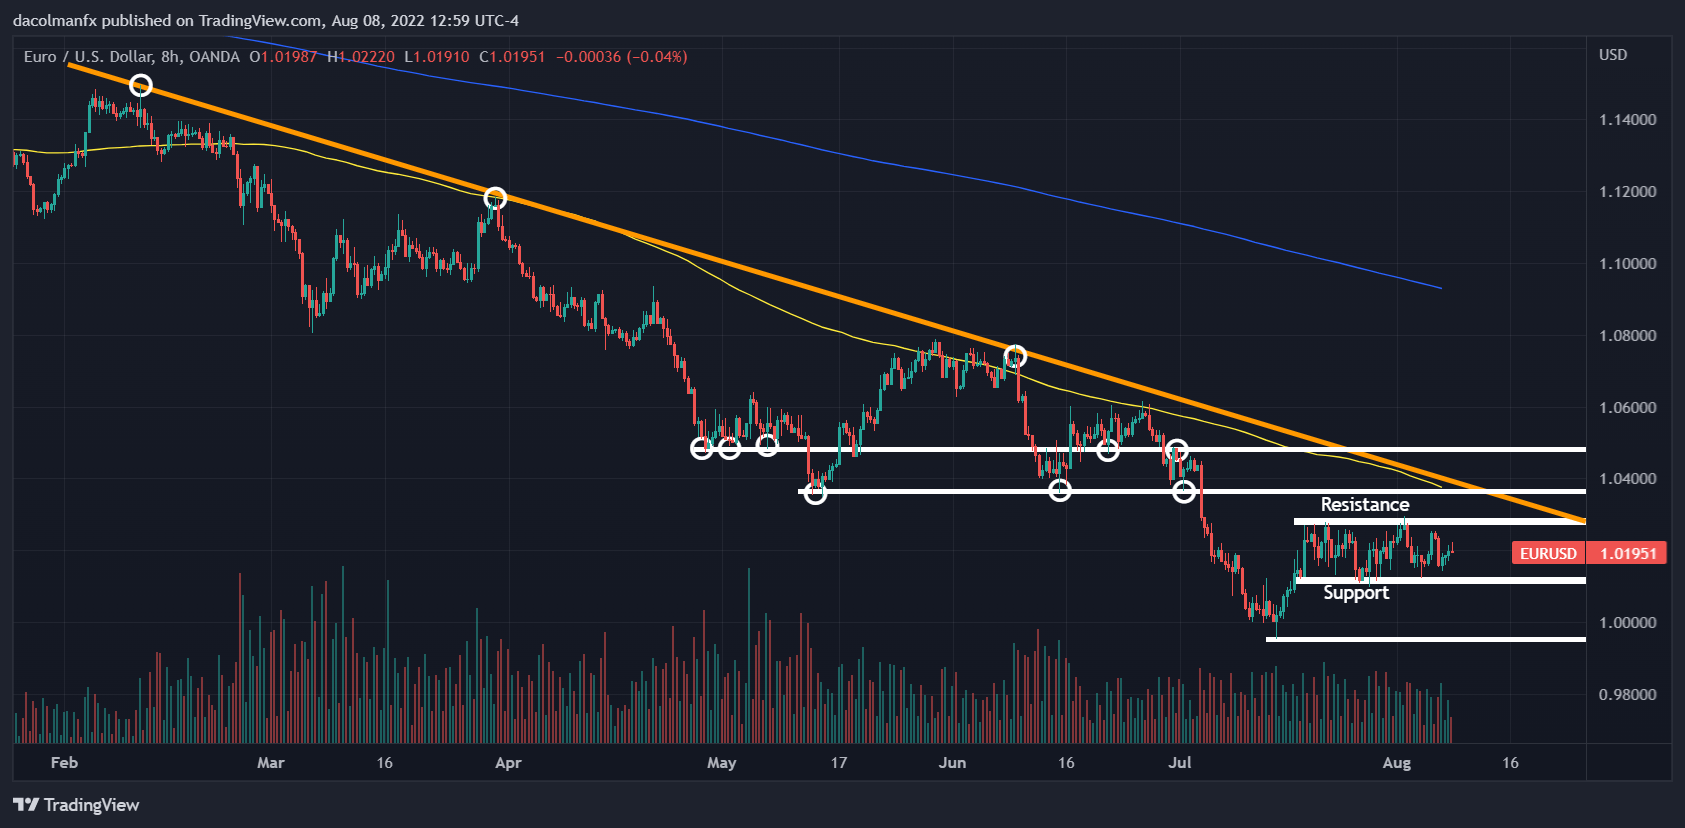
EUR/USD Chart Prepared Using TradingView
EUR/JPY TECHNICAL ANALYSIS
The euro appears to be in a slightly better position against the Japanese yen, thanks in part to improved risk appetite and lower demand for safe-haven assets in global financial markets, but if we have learned anything this year it is that sentiment can turn sour at a moment’s notice. In any case, focusing on recent price action, EUR/JPY is probing the 137.60 area at the start of the week, a key ceiling defined by the 38.2% Fibonacci retracement of the June/August decline. If buyers manage to clear this technical hurdle in the coming days, the next resistance to consider comes at 138.88, followed by 140.17.
On the other hand, if EUR/JPY is rejected from current levels and resumes its descent, initial support appears at 136.90/136.70. If this floor fails to hold, selling impetus could pick up, setting the stage for a slump towards the psychological 135.00 level.
EUR/JPY TECHNICAL CHART
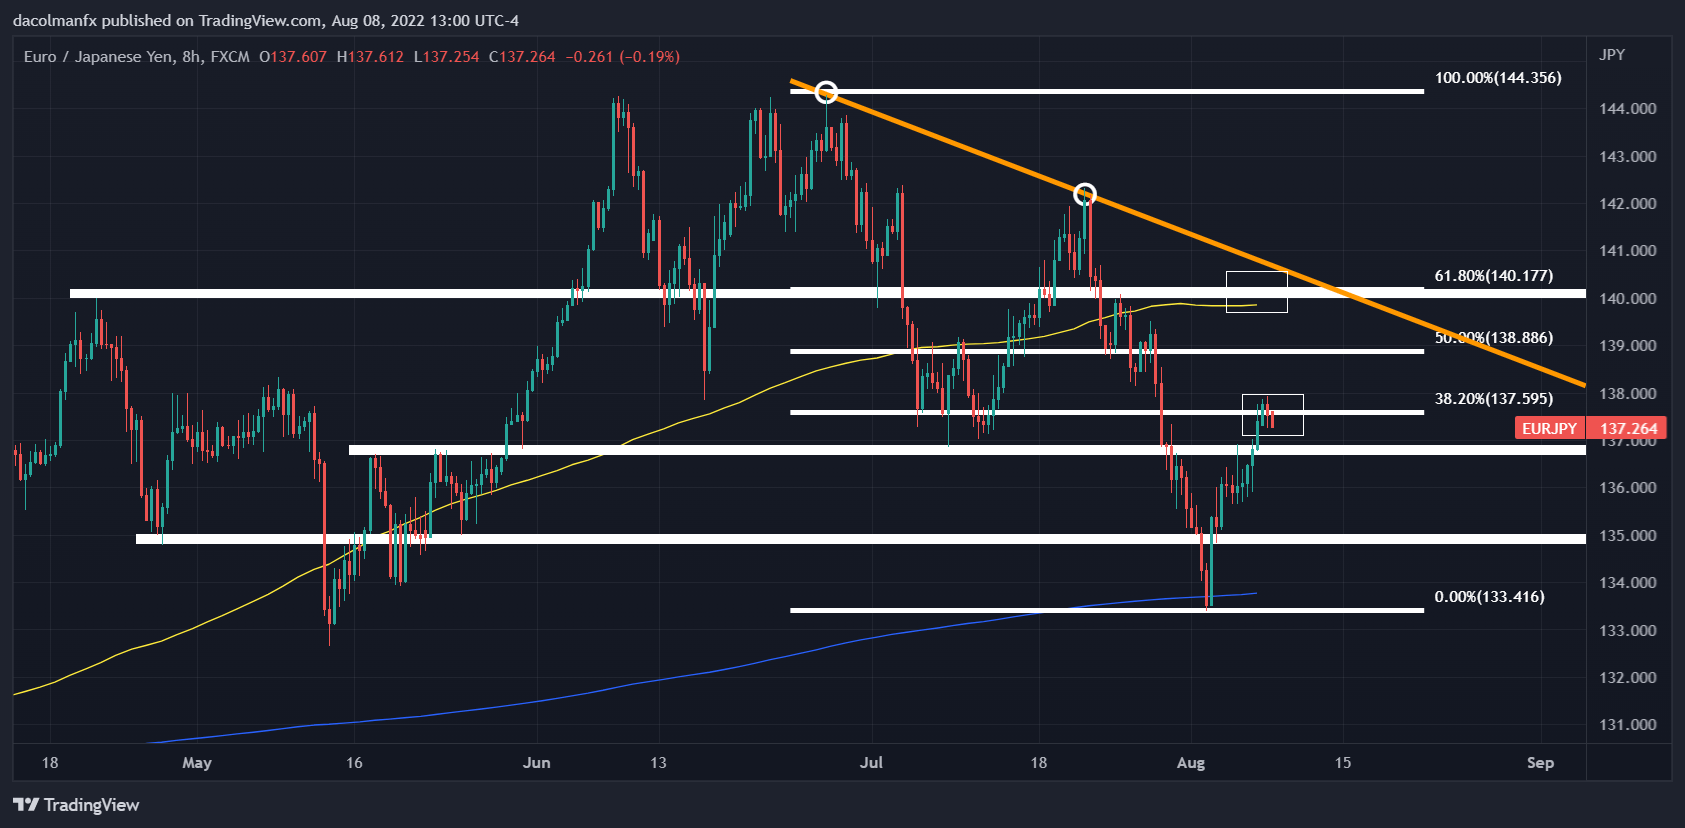
EUR/JPY Chart Prepared Using TradingView
|
|
Leave a Reply
You must be logged in to post a comment.