

S&P 500, Dollar, Fed Forecast, Recession Risks and Liquidity Talking Points:
- The Market Perspective: USDJPY Bullish Above 141; EURUSD Bullish Above 1.0000; Gold Bearish Below 1,750
- Congestion has developed for the S&P 500 and Dollar, which will build upon expectations already presented by the coming Thanksgiving holiday liquidity drain
- The divergence in Fed rate forecasts may pressure a Dollar break, but it is also important to monitor broader rate forecasting and recession threats
Recommended by John Kicklighter
Building Confidence in Trading
Markets Are Giving Up Trends for the Holiday…But Don’t Underestimate Volatility
Not two weeks ago, we were in the midst of exceptional volatility that just so happened to favor ‘risk on’ and a ‘Dollar bearish’ perspective. The catalyst of that move was the lower-than-expected US consumer inflation report which would in turn tap the reliably market-moving theme of interest rate speculation. Despite the speculation around a lower ‘terminal’ benchmark rate this update would touch off, there wasn’t much run after the initial charge. That shouldn’t surprise given that still-high rate of price pressures and the countervailing winds of issues like an inbound recession. There may be a tenuous balance in the macro backdrop, but it the ebb in liquidity that we have ahead that may ultimately keep a risk-measure like the S&P 500 from clearing its well-established technical range, hemmed in by numerous moving averages, Fibonacci retracements and historically-significant levels.
Chart of the S&P 500 with 100 and 200-Day SMAs and 1-Day Rate of Change (Daily)
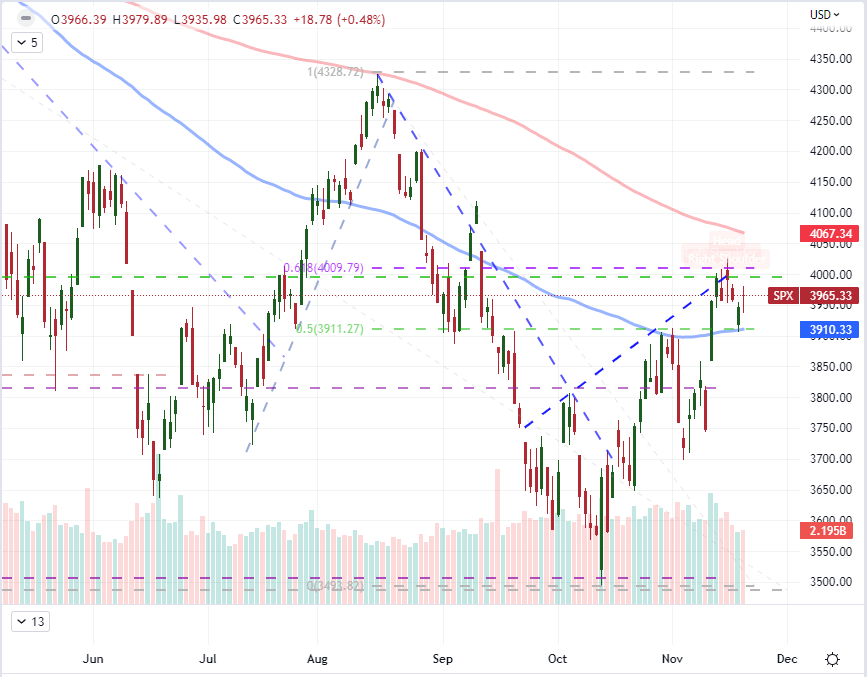
Chart Created on Tradingview Platform
Taking our reference for what’s ahead from the historical norms, the month of November is known as a period for which volume and volatility historically retreat while the underlying S&P 500 has averaged its second-best performance of the calendar year. However, there is further activity to be found within the month itself. On a more granular basis, the 47th week of the year (which we are entering) has averaged the third largest week’s loss of the year. That would seem to conflict with the expectations of a holiday-stunted market backdrop with Thanksgiving on this coming Thursday. It is worth noting that historically, the US holiday doesn’t always fall on the same week of the year – though it is usually between the 47th and 48th week.
Chart of the Average Weekly Performance of the S&P 500 by Calendar Year back to 1900
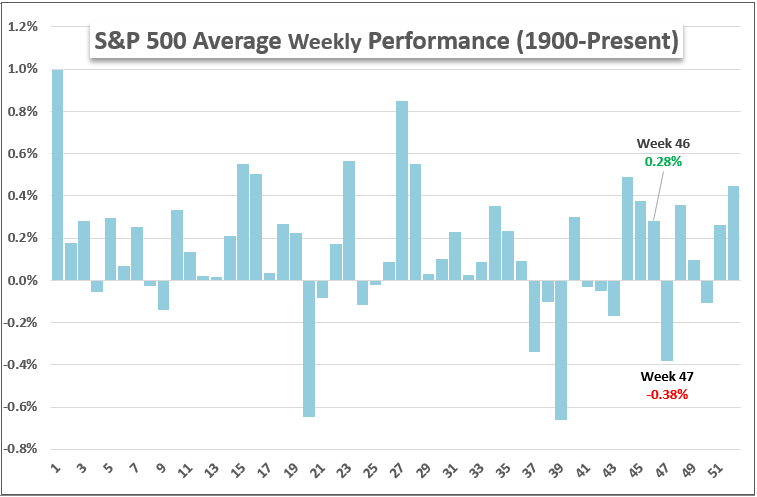
Chart Created by John Kicklighter
Whether Thanksgiving is on the 47th or 48th week of the year, the implications for volatility seem to be about the same. Looking at the historical averages for the VIX back to the start of its official series (1990), there is a drop in activity historically. Then again, there are always opportunities for exceptions. In fact, in 2021, the there was a swell in volatility through the 48th and 49th weeks of the year. It all depends on the market’s fundamental focus along with the scheduled and unscheduled events that cross the wires. On that front, we have a seriously unresolved backdrop for a darkening recession. As for the event risk ahead, there are a few known releases that have the capacity to stir the markets.
Chart of the Current VIX and Average Weekly VIX Level back to 1990
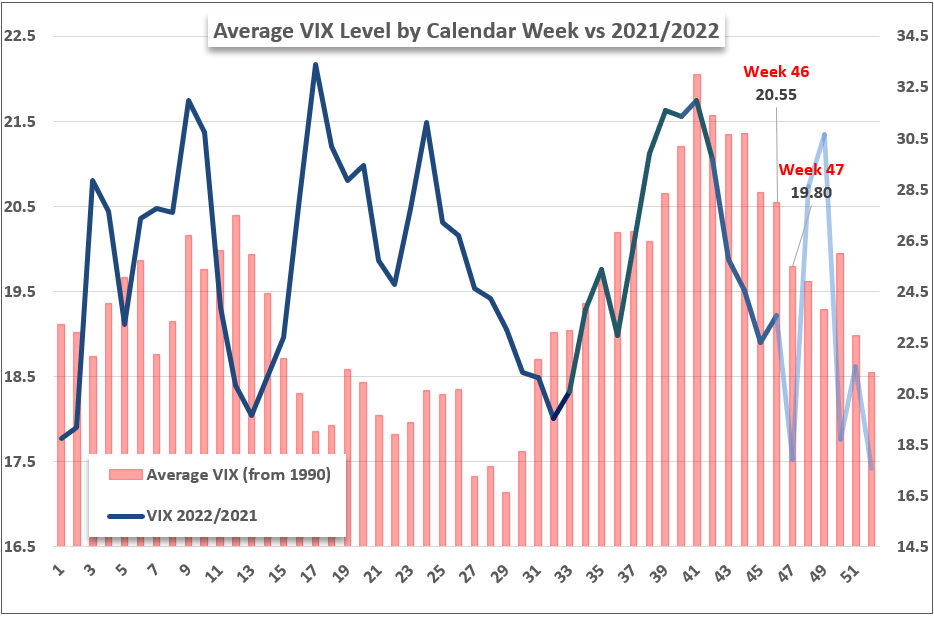
Chart Created by John Kicklighter
Scheduled Event Risk and Themes
From the scheduled economic docket for the coming week, there is certainly a throttling in the noteworthy releases through the end of next week, but there are more than a few high profile listings that I will be monitoring for their volatility potential. For the most comprehensive and global theme, the global and timely picture of economic activity will come through the November PMIs due Wednesday. The compass bearing for these economic measures has been pointing south for a few months with many in technical contraction. If that trend is extended going forward, the threat that reality sinks in will only increase. Meanwhile, indicators like the US National Activity Index from the Chicago Fed, durable goods orders and new home sales will reflect important aspects for the world’s largest economy. Earnings may also be light this week, but the updates from Best Buy, Dollar Tree and even Baidu will speak to important norms (meme carry over, inflation and China).
Critical Macro Event Risk on Global Economic Calendar for the Next Week
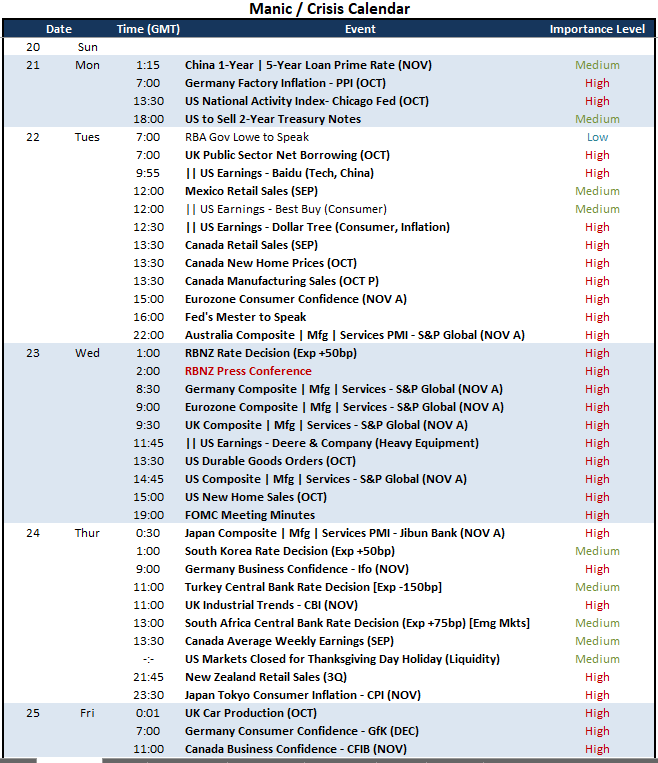
Calendar Created by John Kicklighter
While the threat of recession remains the most nebulous, and thereby potent, fundamental themes moving forward for me; there are other matters that are more than capable of generating volatility. For the US Dollar and capital markets, the outlook for monetary policy is still a serious driver. This past week, Fed speak offered an unmistakable underlying message: that despite the recent ebb in inflation, there was still more tightening that would need to be done – and to a terminal rate higher than they previously projected. Looking to the market’s expectations through Fed Fund futures, the implied rate through June of 2023 only modestly wavered and has since worked its way back up above 5.00 percent. This offers a noticeably divergent short-term standing between these implied rates and the performance of the Dollar. Will they continue to diverge or fall back into line? And, if one corrects to the other; which will capitulate.
Recommended by John Kicklighter
Get Your Free USD Forecast
Chart of the DXY Dollar Index Overlaid with the Implied June 2023 Fed Funds Rate (Daily)
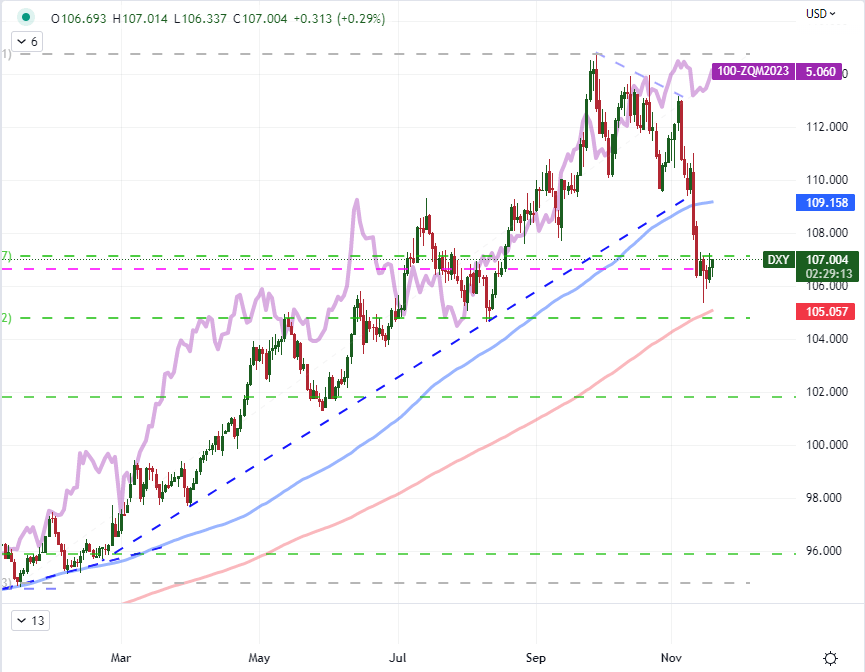
Chart Created on Tradingview Platform
Trade Smarter – Sign up for the DailyFX Newsletter
Receive timely and compelling market commentary from the DailyFX team
Subscribe to Newsletter
|
|
Leave a Reply
You must be logged in to post a comment.