


DAX 30 and S&P 500FORECAST: NEUTRAL
- The FOMC meeting is the main event in next week’s calendar
- Stocks pull back as anticipation builds for a possible taper announcement
There’s one event on everyone’s mind for next week: FOMC. The Federal Reserve will meet on Tuesday and Wednesday to discuss its monetary policy in the midst of a build-up in fundamental anticipation. The central bank has been facing a surge in prices for some time but the latest CPI reading showed the peak in prices may have passed, something Powell has been adamant on since prices began to spike up at the beginning of the year.
And so investors are now faced with a dilemma: the Fed has said there needs to be two conditions met to start tapering assets. One is the jobs market, which has continuously disappointed with fewer jobs than expected being created as vacancies shoot up. The other is inflation, which had met the necessary conditions for a while, but now seems to be coming off slightly. And with the Fed being known for playing down the demand for slower asset purchases and higher rates, it wouldn’t be crazy to assume that investors are slightly apprehensive about the central bank actually delivering at this meeting.
The stock market has been keeping its cards close to its chest with tight ranges heading into this coming week, even having picked up some negative sentiment along the way in the likes of the Nasdaq and the S&P 500 after months of continuous outperformance. I wouldn’t be surprised if we see some further weakness at the beginning of the week as investors position themselves for a possible outcome where the Fed stays on the hawkish side, reducing liquidity in markets and causing stocks to selloff.
Advertisement
S&P 500 KEY LEVELS
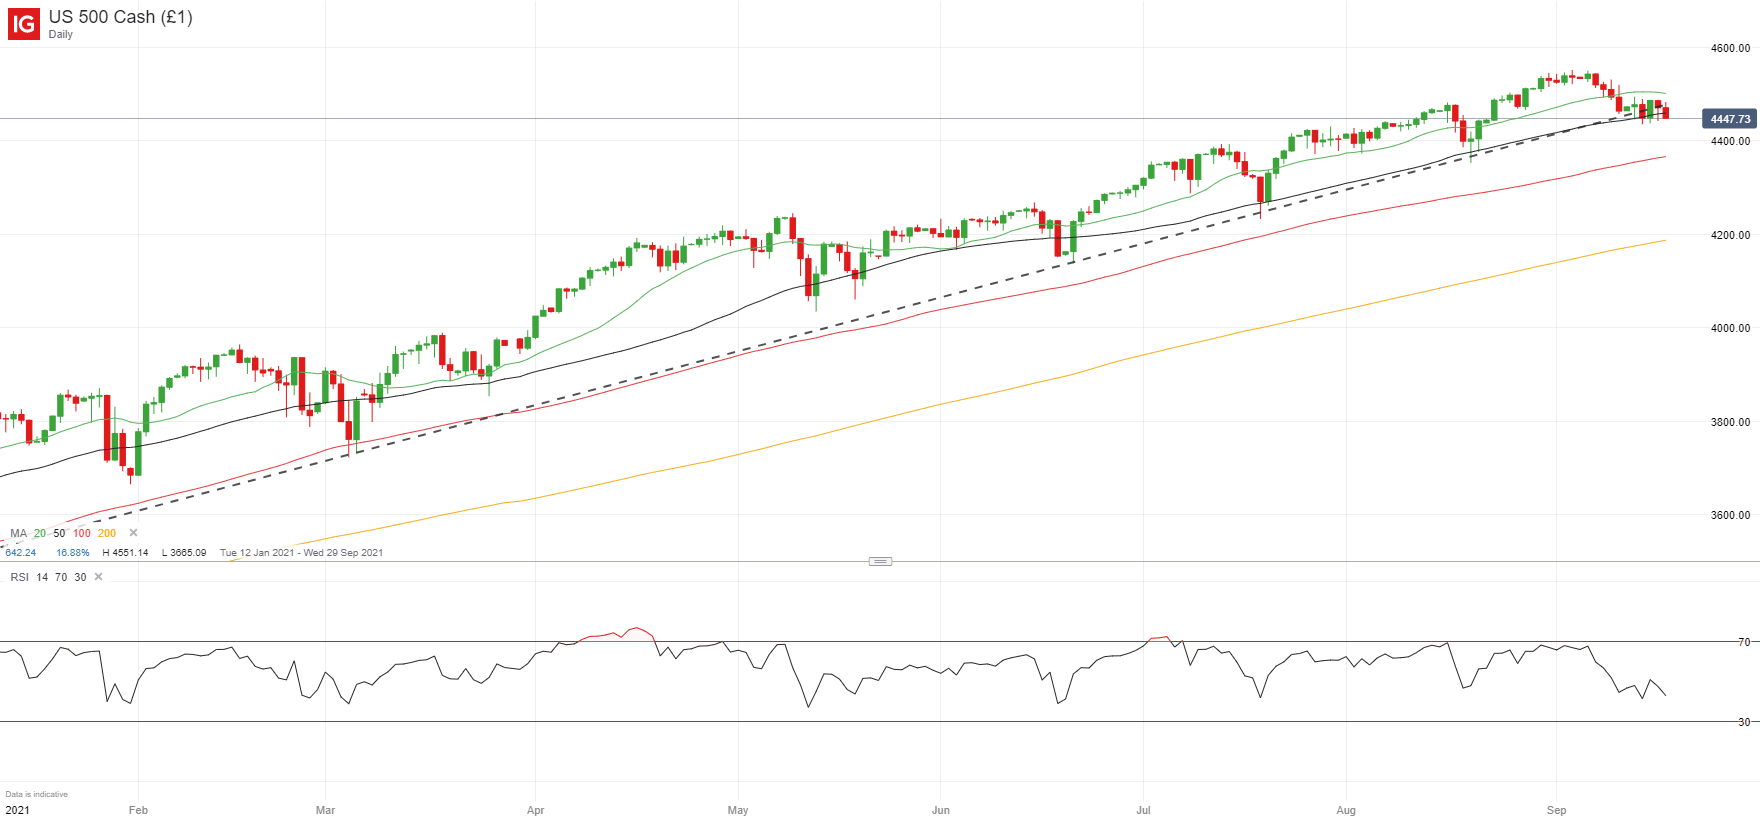
The S&P 500 continues to be marginally lower as it dipped below 4,500 and is struggling to pick itself back up. The key test is the drop below the ascending trendline support which has been in play since October 2020. A deepening of the pullback could put the 4,400 level at risk and that would start to call into question the continuation of the bullish channel we’ve seen since the beginning of the year. A drop below the August low at 4,352 would be a worrying sign that momentum may have changed in the medium term.
S&P 500 Daily Chart
DAX 30 KEY LEVELS
The DAX 30 – which will become the DAX 40 from Sunday evening – has been showing signs of weakness since it reached an all time peak above 16,000 in mid-August, but bearish momentum only picked up with the sell-off last week. A good test of direction will be the 127.2% Fibonacci extension (15,424) which has offered good support for the last few months. A drop below this area leaves buyers exposed to a drop towards 14,815 although there could be some areas of support along the way, including the 200-day SMA at 15,180 and the 15,000 psychological mark.
DAX 30 Daily Chart

Learn more about the stock market basics here or download our free trading guides.
— Written by Daniela Sabin Hathorn, Market Analyst
Follow Daniela on Twitter@HathornSabin
|
|
Leave a Reply
You must be logged in to post a comment.