

FTSE 100 Price, Chart and Analysis:
- FTSE stuck in a rut for now.
- Technical and fundamental drivers converge.
Advertisement
The FTSE 100 has been stuck in a sideways channel for the last few months as the twin themes of Brexit and COVID-19 remain in charge of price action. The UK big board has reclaimed around 40% of the COVID sell-off – a much smaller percentage than other peers – and will remain rangebound until one of the two fundamental themes changes.
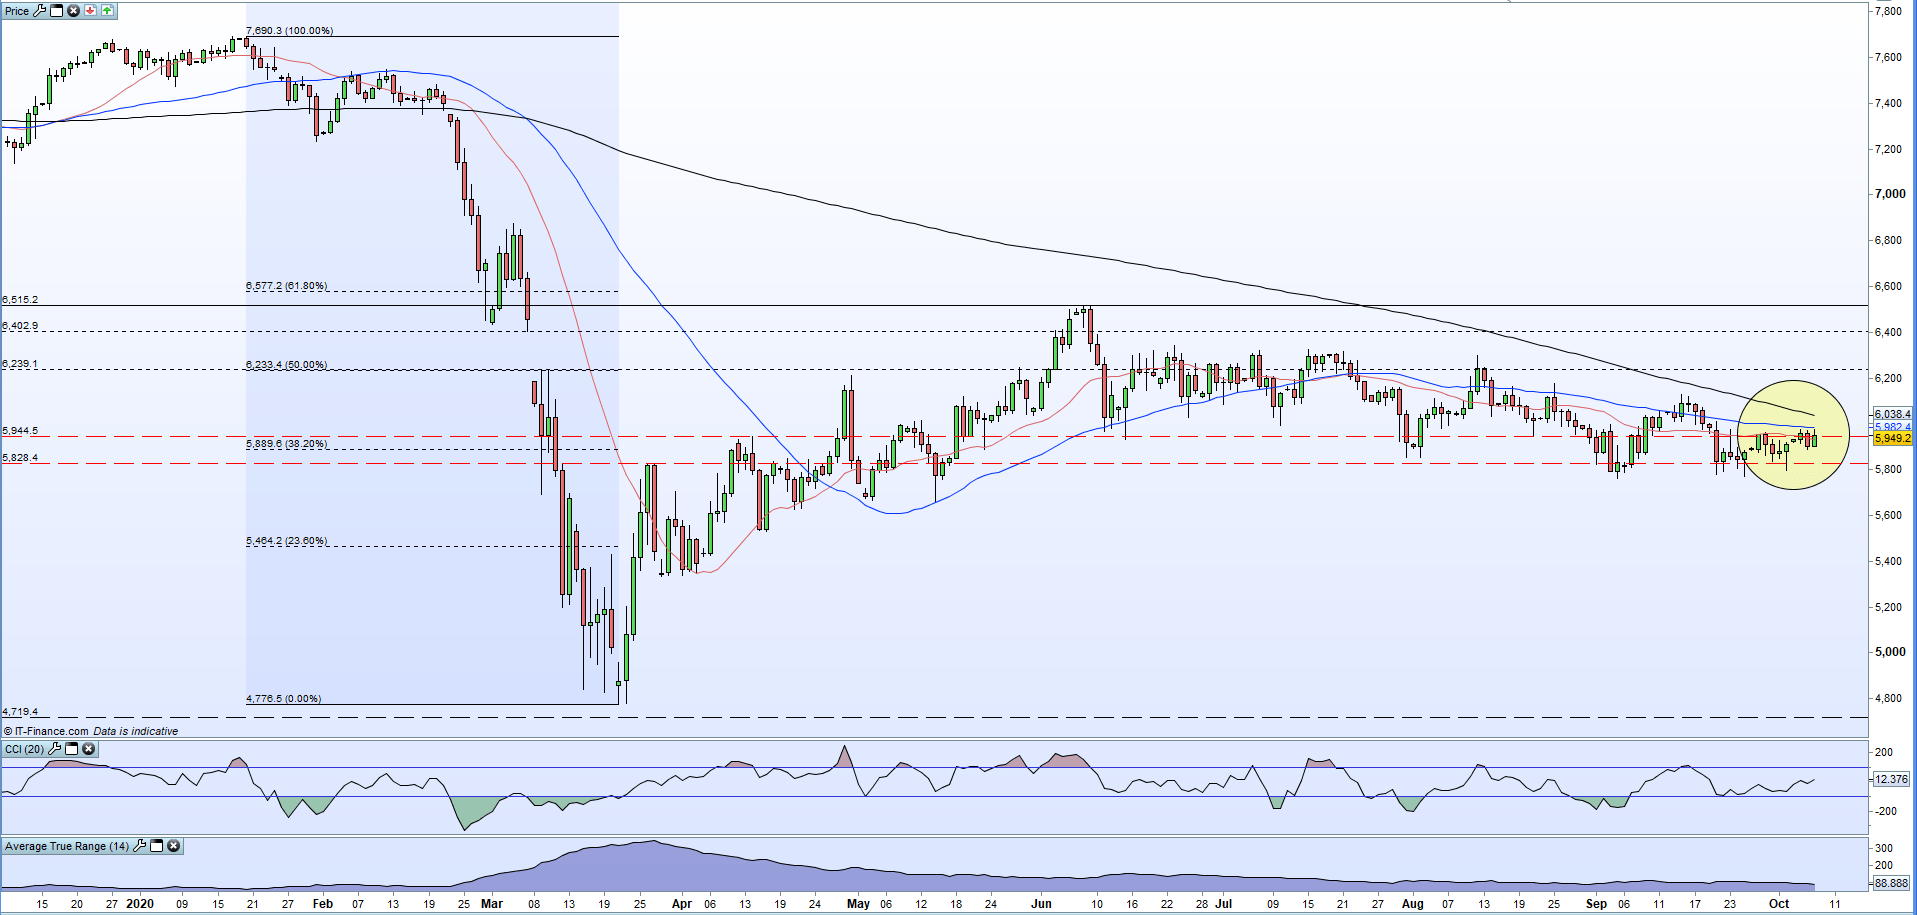
The technical view of the FTSE 100, however, is starting to look more interesting as the recent sideways move has forced all three moving averages to converge near current price action and the 38.2% Fibonacci retracement. This cluster of technical indicators is likely to force a move in the short-term, as low volatility market conditions when faced by a potentially high vol fundamental outlook will shake out loose longs/shorts and draw in new position takers. The narrowing daily trading range this week, as the Brexit deadline nears, highlights the lack of volatility and the potential for a breakout.
The daily chart also shows a series of lower highs from mid-June, while support has stayed firm during this timeframe just below 5,800. As the FTSE nears the apex of the descending lows and current support, a breakout becomes even more likely.

Recommended by Nick Cawley
Get Your Free Equities Forecast
FTSE 100 Daily Price Chart (December 2019 – October 7, 2020)
| Change in | Longs | Shorts | OI |
| Daily | 1% | 2% | 2% |
| Weekly | -11% | 33% | 1% |
IG client sentiment data shows 66.21% of traders are net-long with the ratio of traders long to short at 1.96 to 1.The number of traders net-long is 1.55% higher than yesterday and 6.04% lower from last week, while the number of traders net-short is 10.63% lower than yesterday and 16.44% higher from last week.We typically take a contrarian view to crowd sentiment, and the fact traders are net-long suggests FTSE 100 prices may continue to fall.
Positioning is more net-long than yesterday but less net-long from last week. The combination of current sentiment and recent changes gives us a further mixed FTSE 100 trading bias.
Traders of all levels and abilities will find something to help them make more informed decisions in the new and improved DailyFX Trading Education Centre
What is your view on the FTSE – bullish or bearish?? You can let us know via the form at the end of this piece or you can contact the author via Twitter @nickcawley1.
|
|
Leave a Reply
You must be logged in to post a comment.