

Gold Price Talking Points
The price of gold marks another failed attempt to test the September low ($1849) as it bounces back from a fresh weekly low ($1853), and the precious metal may continue to move to the beat of its own drum even though the Federal Reserve’s balance sheet climbs to a fresh record high in November.
Advertisement
Gold Snaps Bearish Price Pattern Amid Failure to Test September Low
The price of goldmay trade within a defined range ahead of the Federal Open Market Committee’s (FOMC) last meeting for 2020 as it snaps the series of lower highs and lows from earlier this week, but the correction from the record high ($2075) may turn out to be an exhaustion in the bullish trend rather than a change in behavior as key market themes look poised to persist in the year ahead.
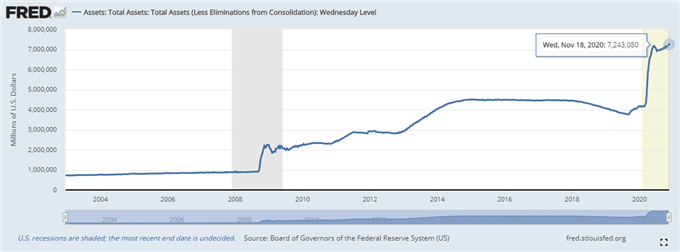
The Fed’s balance sheet increased to a fresh record high of $7.243 trillion in the week of November 18 from $7.175 trillion the week prior as the central vows to “increase its holdings of Treasury securities and agency mortgage-backed securities at least at the current pace.” However, the FOMC may come under pressure to further support the US economy as Treasury Secretary Steven Mnuchin requests a “90-day extension of the Commercial Paper Funding Facility (CPFF), the Primary Dealer Credit Facility (PDCF), the Money Market Liquidity Facility (MMLF) and the Paycheck Protection Program Liquidity Facility (PPPLF),” with the remaining lending facilities set to expire at the end of the year.
It remains to be seen if FOMC will offer a more dovish forward guidance at its next interest rate decision on December 16 as the recent rise in daily COVID-19 cases raises the threat for a protracted recovery, but it seems as though Chairman Jerome Powell and Co. will rely on its current tools to backstop the economic recovery as Chicago Fed President Charles Evans, a voting-member on the FOMC in 2021, insists that the central bank “can do more with enhanced asset purchasing.”
In turn, the low interest environment along with the ballooning central bank balance sheets may continue to provide a backstop for gold prices as major central banks become increasingly reliant on their non-standard tools, and the crowding behavior in the Greenback also looks poised to persist as the net-long US Dollar bias from earlier this resurfaces in November.

The IG Client Sentiment report shows retail traders are net-long USD/CHF, USD/JPY and USD/CAD, while the crowd is net-short GBP/USD, AUD/USD, EUR/USD and NZD/USD even though the New Zealand Dollar clears the 2019 high (0.6942).
It seems as though key market trends will carry into December even though the price of gold no longer traders to fresh yearly highs during every single month in 2020, but the correction from the record high ($2075) may turn out to be an exhaustion in the bullish trend rather than a change in behavior as the US Dollar continues to broadly reflect an inverse relationship with investor confidence.
With that said, gold may trade in a defined range over the coming days the precious metal stages another failed attempt to test the September low ($1849), and the price for bullion may continue to track the September range as it snaps the series of lower highs and lows from earlier this week

Recommended by David Song
Learn More About the IG Client Sentiment Report
Gold Price Daily Chart
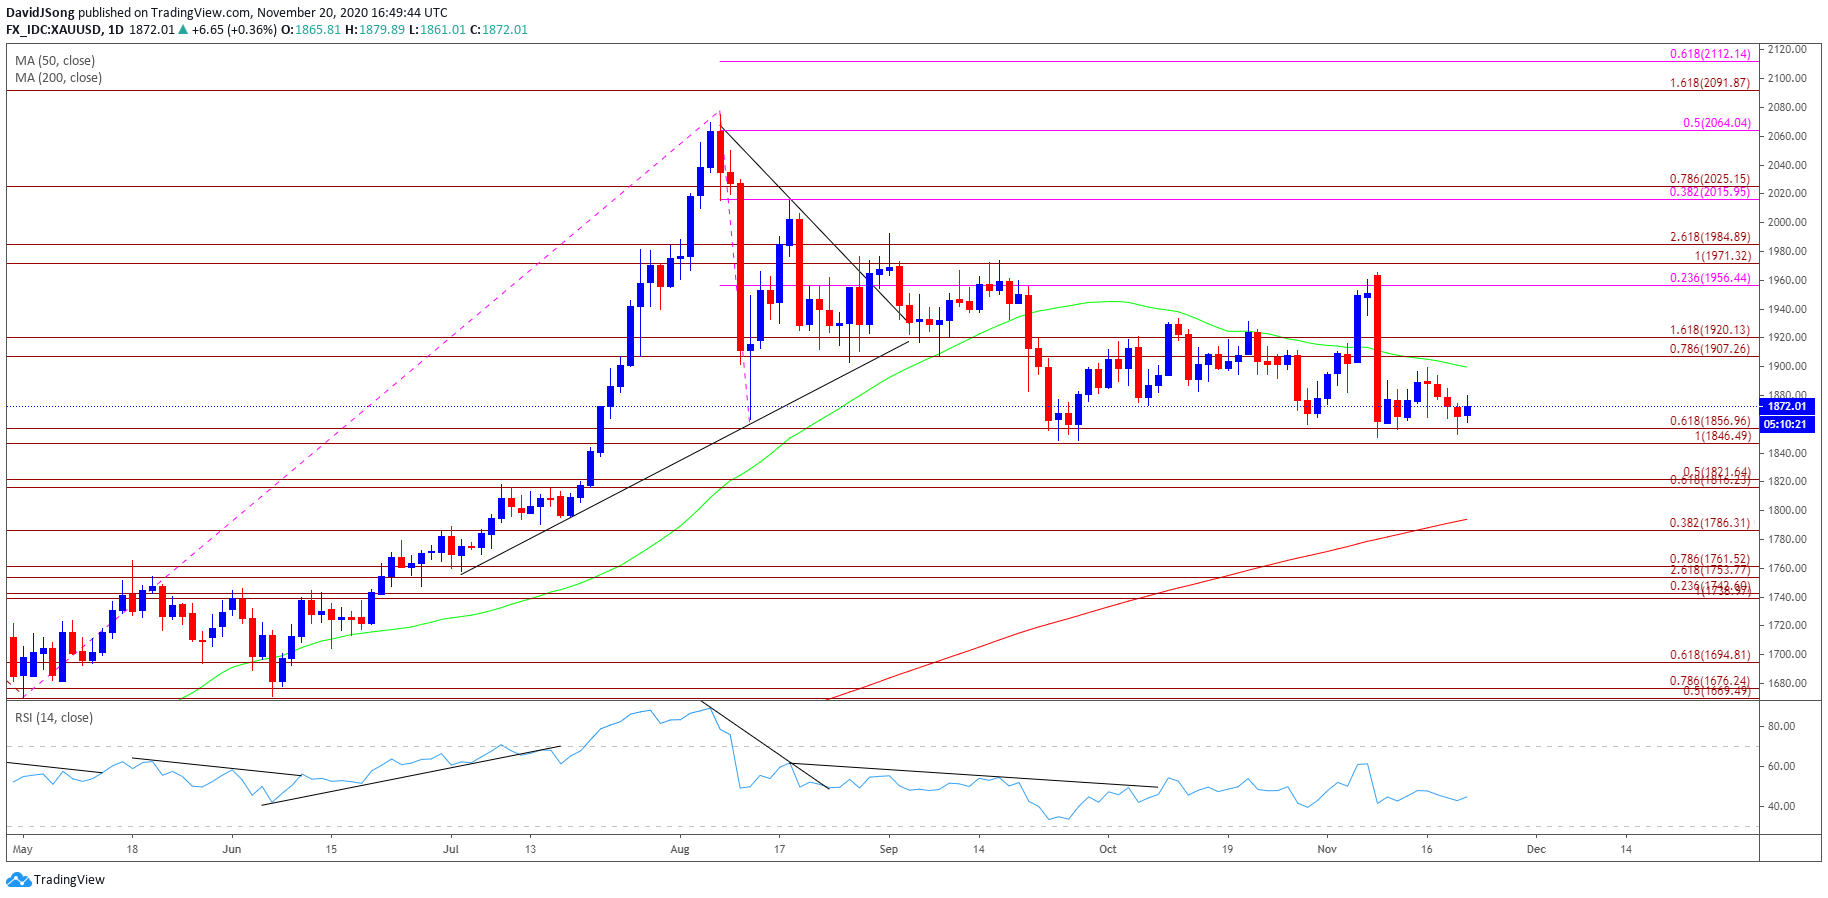
Source: Trading View
- The price of gold pushed to fresh yearly highs throughout the first half 2020, with the bullish price action also taking shape in August as the precious metal tagged a new record high ($2075).
- However, the bullish behavior failed to materialize in September as the price of gold traded below the 50-Day SMA ($1900) for the first time since June, with developments in the Relative Strength Index (RSI) negating the wedge/triangle formation established in August as the oscillator slipped to its lowest level since March.
- Nevertheless, the decline from the record high ($2075) may turn out to be an exhaustion in the bullish trend rather than a change in market behavior as the RSI breaks out of the downward trend carried over from August and recovers from its lowest readings since March.
- As a result, the price of gold may continue to hold above the $1847 (100% expansion) to $1857 (61.8% expansion) region amid the string of failed attempt to test the September low ($1849), but need a move above the Fibonacci overlap around $1907 (100% expansion) to $1920 (161.8% expansion) to bring the $1956 (23.6% expansion) area on the radar.
- Need a break of the monthly high ($1966) to open up the $1971 (100% expansion) to $1985 (261.8% expansion) region, with the next area of interest coming n around $2016 (38.2% expansion) to $2025 (78.6% expansion).

Recommended by David Song
Traits of Successful Traders
— Written by David Song, Currency Strategist
Follow me on Twitter at @DavidJSong
|
|
Leave a Reply
You must be logged in to post a comment.