Gold (XAU/USD) Analysis, Price and Chart
- Gold is pulling back from its recent low.
- IG client sentiment and positioning suggest higher prices.
Gold is nudging higher as we go into the close, fuelled by a distinct risk-off move across a swathe of markets. The ongoing Brexit saga is reaching its endpoint with, at the moment, a no-deal outcome the likely scenario, adding to the risk-off sentiment, while friction between the US and China remains close beneath the surface. Equity markets across the globe also printed record rallies in November and the oft-talked about ‘Santa Rally’ may have happened one month early. And just to add further fuel to the fire – and probably the most important ongoing risk factor – Covid-19 numbers for both infections and fatalities continue to hit unwanted record highs, forcing countries across the world to impose further stringent, and economically damaging, lockdown measures.
How to Trade Gold: Top Gold Trading Strategies and Tips
Next week sees a few heavyweight data releases and events with the last FOMC meeting of the year probably the most important. It is widely expected that the Fed will either loosen monetary policy further to help strengthen the US economy or at the very least ramp up its dovish rhetoric in case of further economic headwinds.
This will leave the US dollar, and gold due to its relationship with the greenback, caught between two major drivers – a haven bid for the dollar as investors shun risk or further weakness in the USD due to Fed dovishness.
To learn more about moving averages, check out DailyFX Education
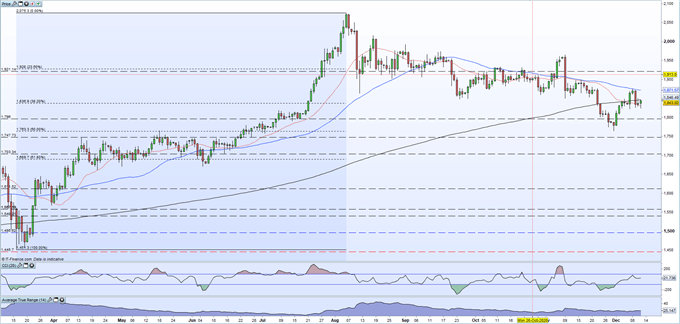
Gold has found some support this week from the 20-day simple moving average with the $1,820/oz. zone providing support slightly lower down. The upside is currently being blocked by the long-dated moving average at $1,846/oz. ahead of the 50-day sma at $1,871/oz. The mixed nature of the moving averages highlights the current market indecision.
Gold Daily Price Chart (March – December 11, 2020)
| Change in | Longs | Shorts | OI |
| Daily | -3% | 10% | -1% |
| Weekly | -6% | 7% | -4% |
IG retail trader data show 79.59% of traders are net-long with the ratio of traders long to short at 3.90 to 1.We typically take a contrarian view to crowd sentiment, and the fact traders are net-long suggests Gold prices may continue to fall.Yet traders are less net-long than yesterday and compared with last week. Recent changes in sentiment warn that the current Gold price trend may soon reverse higher despite the fact traders remain net-long.


Recommended by Nick Cawley
Trading Forex News: The Strategy
What is your view on Gold – are you bullish or bearish?? You can let us know via the form at the end of this piece or you can contact the author via Twitter @nickcawley1.
|
|


Leave a Reply
You must be logged in to post a comment.