

Gold (XAU/USD) Price Outlook:
- Gold has climbed nearly 30% in the year-to-date, soaring to its highest Dollar-denominated price ever
- Concern rippled through the market as the precious metal suffered a notable decline last week
- Still, the foundational elements of the recent rally remain and the bull run may continue as a result
Gold Price Forecast: XAU/USD Rebounds, Will the Bull Case Continue?
Gold is off to a strong start this week as bulls have seemingly returned to the precious metal following a drastic decline last week. Alongside an immediate hit to price, the selloff sparked worries for the longer-term outlook of the commodity. That said, many of the conditions that have allowed gold to soar in 2020 remain and could continue to fuel price gains, despite recent jitters.
Gold Price Chart: Weekly Time Frame (July 2011 – August 2020)

As an investment, gold is often viewed as a potential hedge against inflation, while simultaneously providing safety in times of volatility. Therefore, the conditions that have been brought about by covid – volatility, low interest rates and expanding central bank balance sheets – should translate into higher demand for the precious metal and consequently, higher prices. Many analysts and commentators have attributed the 2020 gold price rally to these themes and, luckily for bulls, the same tailwinds remain despite recent declines.

Recommended by Peter Hanks
Traits of Successful Traders
With that in mind, I would argue the recent price pullback is a form of healthy consolidation instead of a reaction to a shift in the underlying fundamentals. While a recent spike in yields could erode the price of gold if sustained, there is little to suggest that yields will be revived in the near future, so the bull case for the yellow metal remains and the next barrier for XAU/USD may reside near its all-time high at $2,075.
Gold Price Chart: 4 – Hour Time Frame (January 2020 – August 2020)
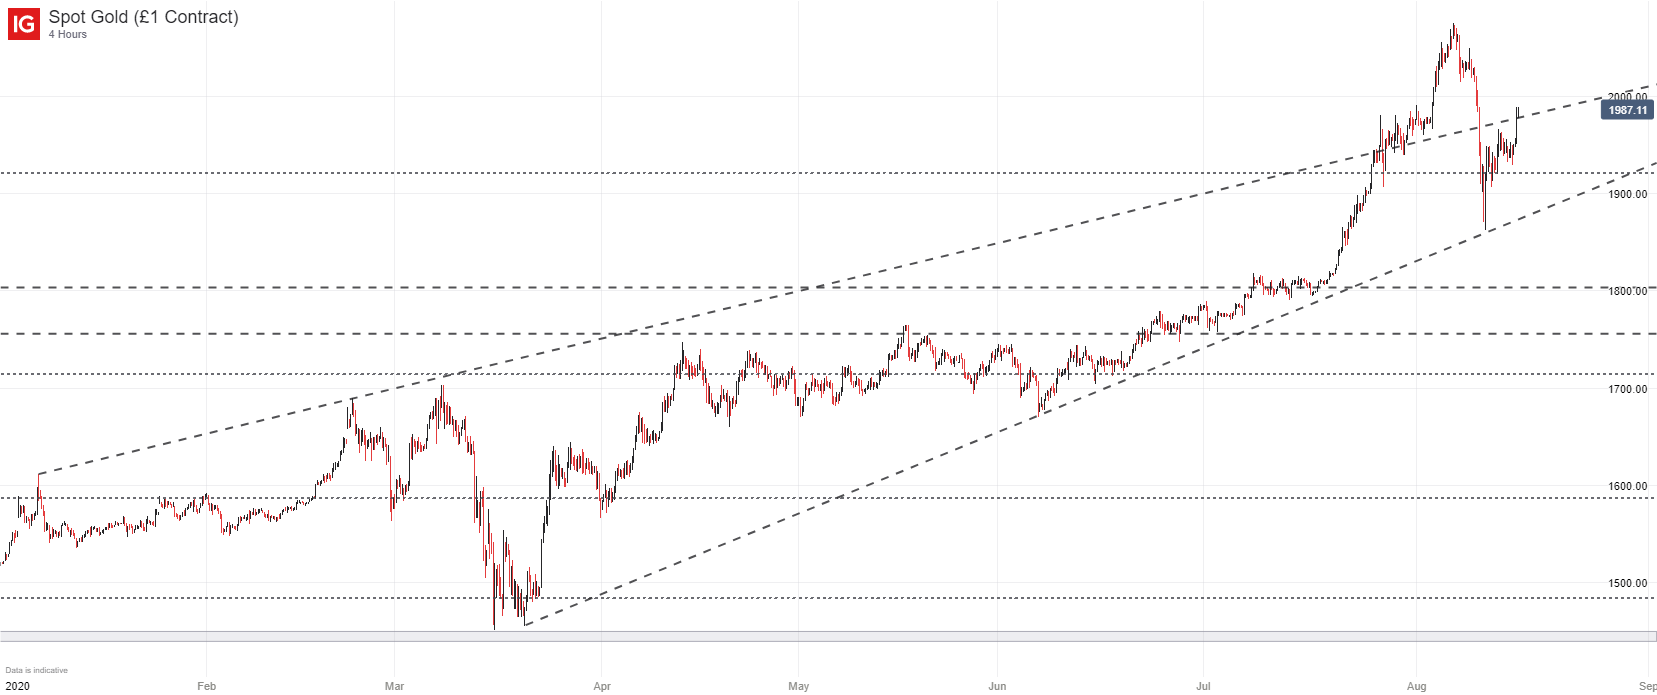
Technically speaking, XAU/USD may enjoy support from the areas around $1,985, $1,920 and $1,861 on the shorter time frames if selling pressure returns. In the broader view, I suspect $1,800 may hold some psychological influence that could allow selling to accelerate if pierced, but it seems possible that gold could continue higher unless such a move is attempted. In the meantime, follow @PeterHanksFX on Twitter for updates and analysis.
Find Market Turning Points with Support & Resistance
–Written by Peter Hanks, Strategist for DailyFX.com
Contact and follow Peter on Twitter @PeterHanksFX
|
|
Leave a Reply
You must be logged in to post a comment.