

Gold Price Forecast, Gold Analysis, GLD, XAU/USD:
- Gold prices remain strong, holding near another new all-time-high established shortly after the open of this week’s trade.
- Gold prices have become fairly overbought on the Daily chart, and a big level sits just ahead around the 2k marker on the chart.
- Short-term Gold price action has built an ascending triangle formation, which will often be approached with the aim of bullish breakouts. This could bring a backdrop supportive of bullish themes, at least near-term.
Gold Prices Breakout, and Breakout and Breakout
The bullish breakout in Gold has continued as last week finally saw the yellow metal push up to a fresh all-time-high. Perhaps even more impressive than the fresh all-time-high was the manner in which it happened, as Gold prices broke out aggressively and just continued to run, all the way towards the $2,000 level that’s never been traded at. The FOMC rate decision last week seemed to help a bit, as that breakout held recent gains, followed by a shallow pullback on Thursday that was quickly bought-up by buyers on Friday. But as we come into a fresh week, the onus is on bulls as we’ve now seen resistance at the 1980 level for four of the past five trading days.
Starts in:
Live now:
Aug 04
( 17:08 GMT )

James Stanley’s Tuesday Webinar
Trading Price Action
But, also of interest and something that may help to keep bulls on the bid – as that resistance has held, it’s also seemed to elicit a diminishing impact, as denoted by the higher-lows making up the bullish trendline on the below chart. This series of higher-lows around support coupled with horizontal resistance makes for an ascending triangle formation – very similar to what was looked at just a couple of weeks ago. Such a formation will often be approached with the aim of bullish breakouts, carried by the expectation for the same strength that’s brought in bulls at higher-lows to, eventually, play through for a break of the horizontal resistance level.
Also of encouragement to bulls: Resistance has been showing signs of pressure given the recent, albeit minor higher-highs that have come-in, including shortly after the open of this week’s trade; highlighting that defense around that 1980 level may not last for much longer.
Gold Price Two-Hour Chart
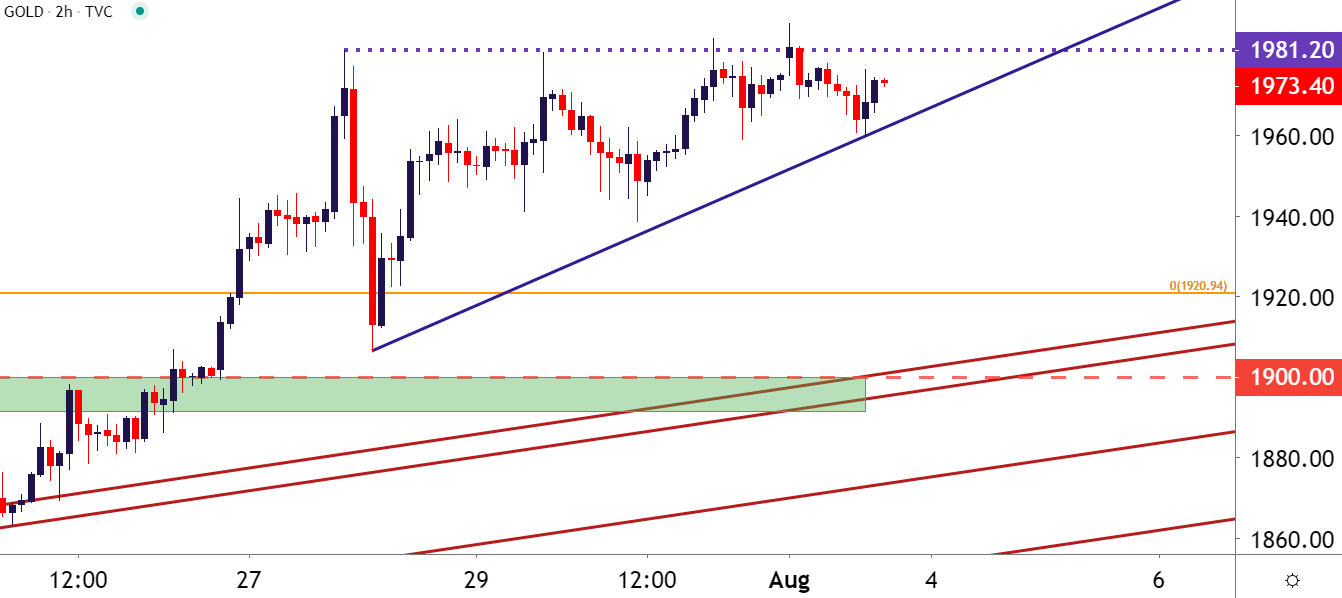
Chart prepared by James Stanley; Gold on Tradingview
Just above current resistance is a major psychological level of $2,000 and, should this come into play, the natural question is one of sustainability for the bullish trend. That can be a more difficult item to project at the moment because Gold prices remain overbought from a variety of angles.

Recommended by James Stanley
Get Your Free Top Trading Opportunities Forecast
Taking a step back to the Daily chart highlights just how aggressive this recent bullish run has become: It was only a-month-and-a-half ago that Gold prices were confined to a two-month-range, even as a series of financial events were popping off around global financial markets. That range even held through a fairly clear statement from the Fed, when the FOMC said that there was ‘no limit’ to what they could do with the liquidity programs available to them. The false breakout that showed around that theme is highlighted in a yellow box on the below chart.

Recommended by James Stanley
Download our Q3 Gold Forecast
This recent Gold run has been underpinned by a huge bearish move in the US Dollar, and that theme carries its own questions of sustainability. This can create a difficult backdrop for longer-term Gold analysis, in which the first trip to the 2k level may be met with a bit of pressure that could, possibly create a pullback. Of note for pullback potential would be that prior all-time-high around the 1920 level, and perhaps even as deep as 1900. RSI is currently trading above the 80 level on the Daily chart of Gold, and this makes for a difficult projection for continued strength, at least until some element of a pullback plays in.
Gold Daily Price Chart: RSI Deep in Overbought, 2k Near
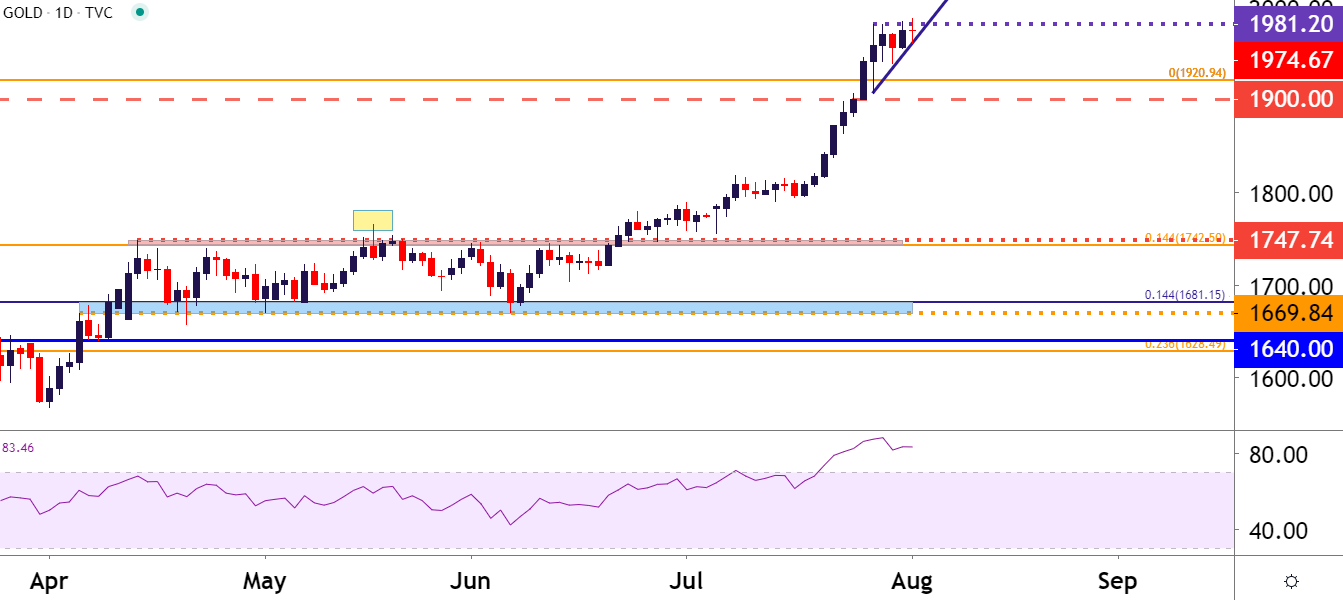
Chart prepared by James Stanley; Gold on Tradingview
— Written by James Stanley, Strategist for DailyFX.com
Contact and follow James on Twitter: @JStanleyFX
|
|
Leave a Reply
You must be logged in to post a comment.