

Gold Prices, US Presidential Election, FOMC, Non-Farm Payrolls, US Senate Race – Talking Points:
- The increasing likelihood of a Biden presidency appear to be underpinning gold prices.
- Although unlikely, the potential of a ‘Blue Wave’ may put a premium on precious metals.
- Fed Chair Jerome Powell’s hint at adjustment to asset purchases could buoy bullion.
Advertisement
Asia-Pacific Recap
The haven-associated US Dollar and Japanese Yen moved higher during Asia-Pacific trade, as US presidential election votes continue to be tallied.
Australia’s ASX 200 index crept higher alongside Japan’s Nikkei 225, while S&P 500 futures nudged marginally lower.
Gold and silver slipped despite yields on US 10-year Treasuries holding relatively steady.
Looking ahead, the US non-farm payrolls report for the month of October headlines the economic docket.
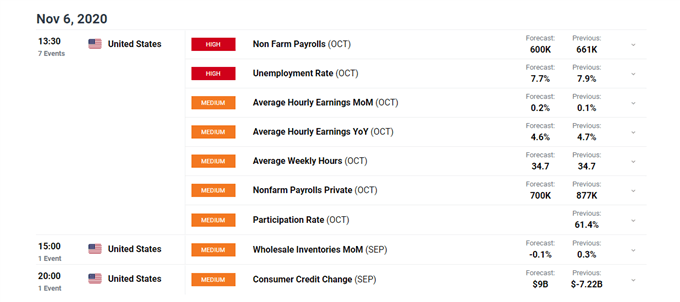
DailyFX Economic Calendar
Likely Biden Win to Fuel Gold Prices
The increasing likelihood of a Joe Biden presidency could continue to buoy the price of liquidity-driven precious metal prices, despite the fight for control of the US Senate expected to prolong until January 5.
At the time of writing, Mr Biden has 4 paths to win just 6 more Electoral College (EC) votes while incumbent President Donald Trump has one route to achieve the 56 EC votes needed to retain the White House.
Although Trump has attempted to undermine the validity of the mail-in/absentee ballot process by stating that “if you count the legal votes, I easily win”, suggesting there is wide-spread voter fraud without a sliver of evidence and filing a series of legal challenges in crucial swing states, Biden’s recent performance has tempered concerns of a contested election.
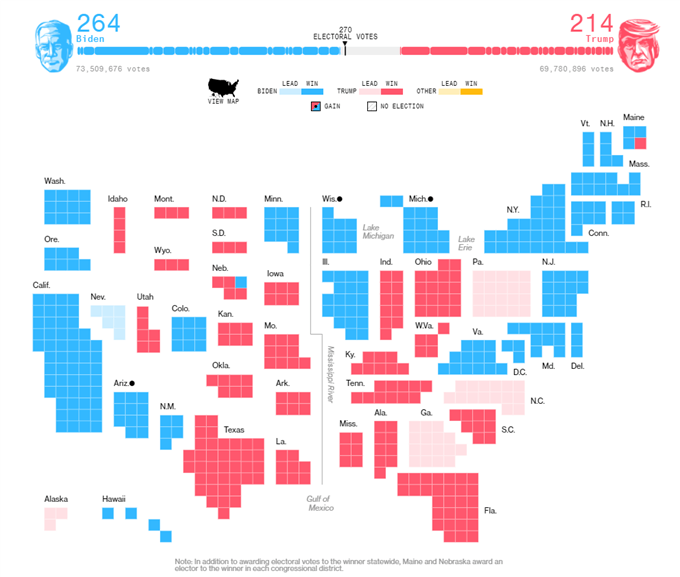
Source – Bloomberg
The former Vice President is currently leading in Arizona and Nevada, while staging a substantial comeback in Pennsylvania and Georgia. Indeed, with the outstanding ballots expected to favour the Democratic nominee, wins in three of the four aforementioned states seems relatively likely.
Of course, with vote counting ongoing this is hardly a certainty. Nevertheless, a continuation of the current trends could see Mr Biden beat the incumbent President in multiple battleground states, reducing the overall effectiveness of legal challenges from the Trump team and capping the upside for the haven-associated USD.
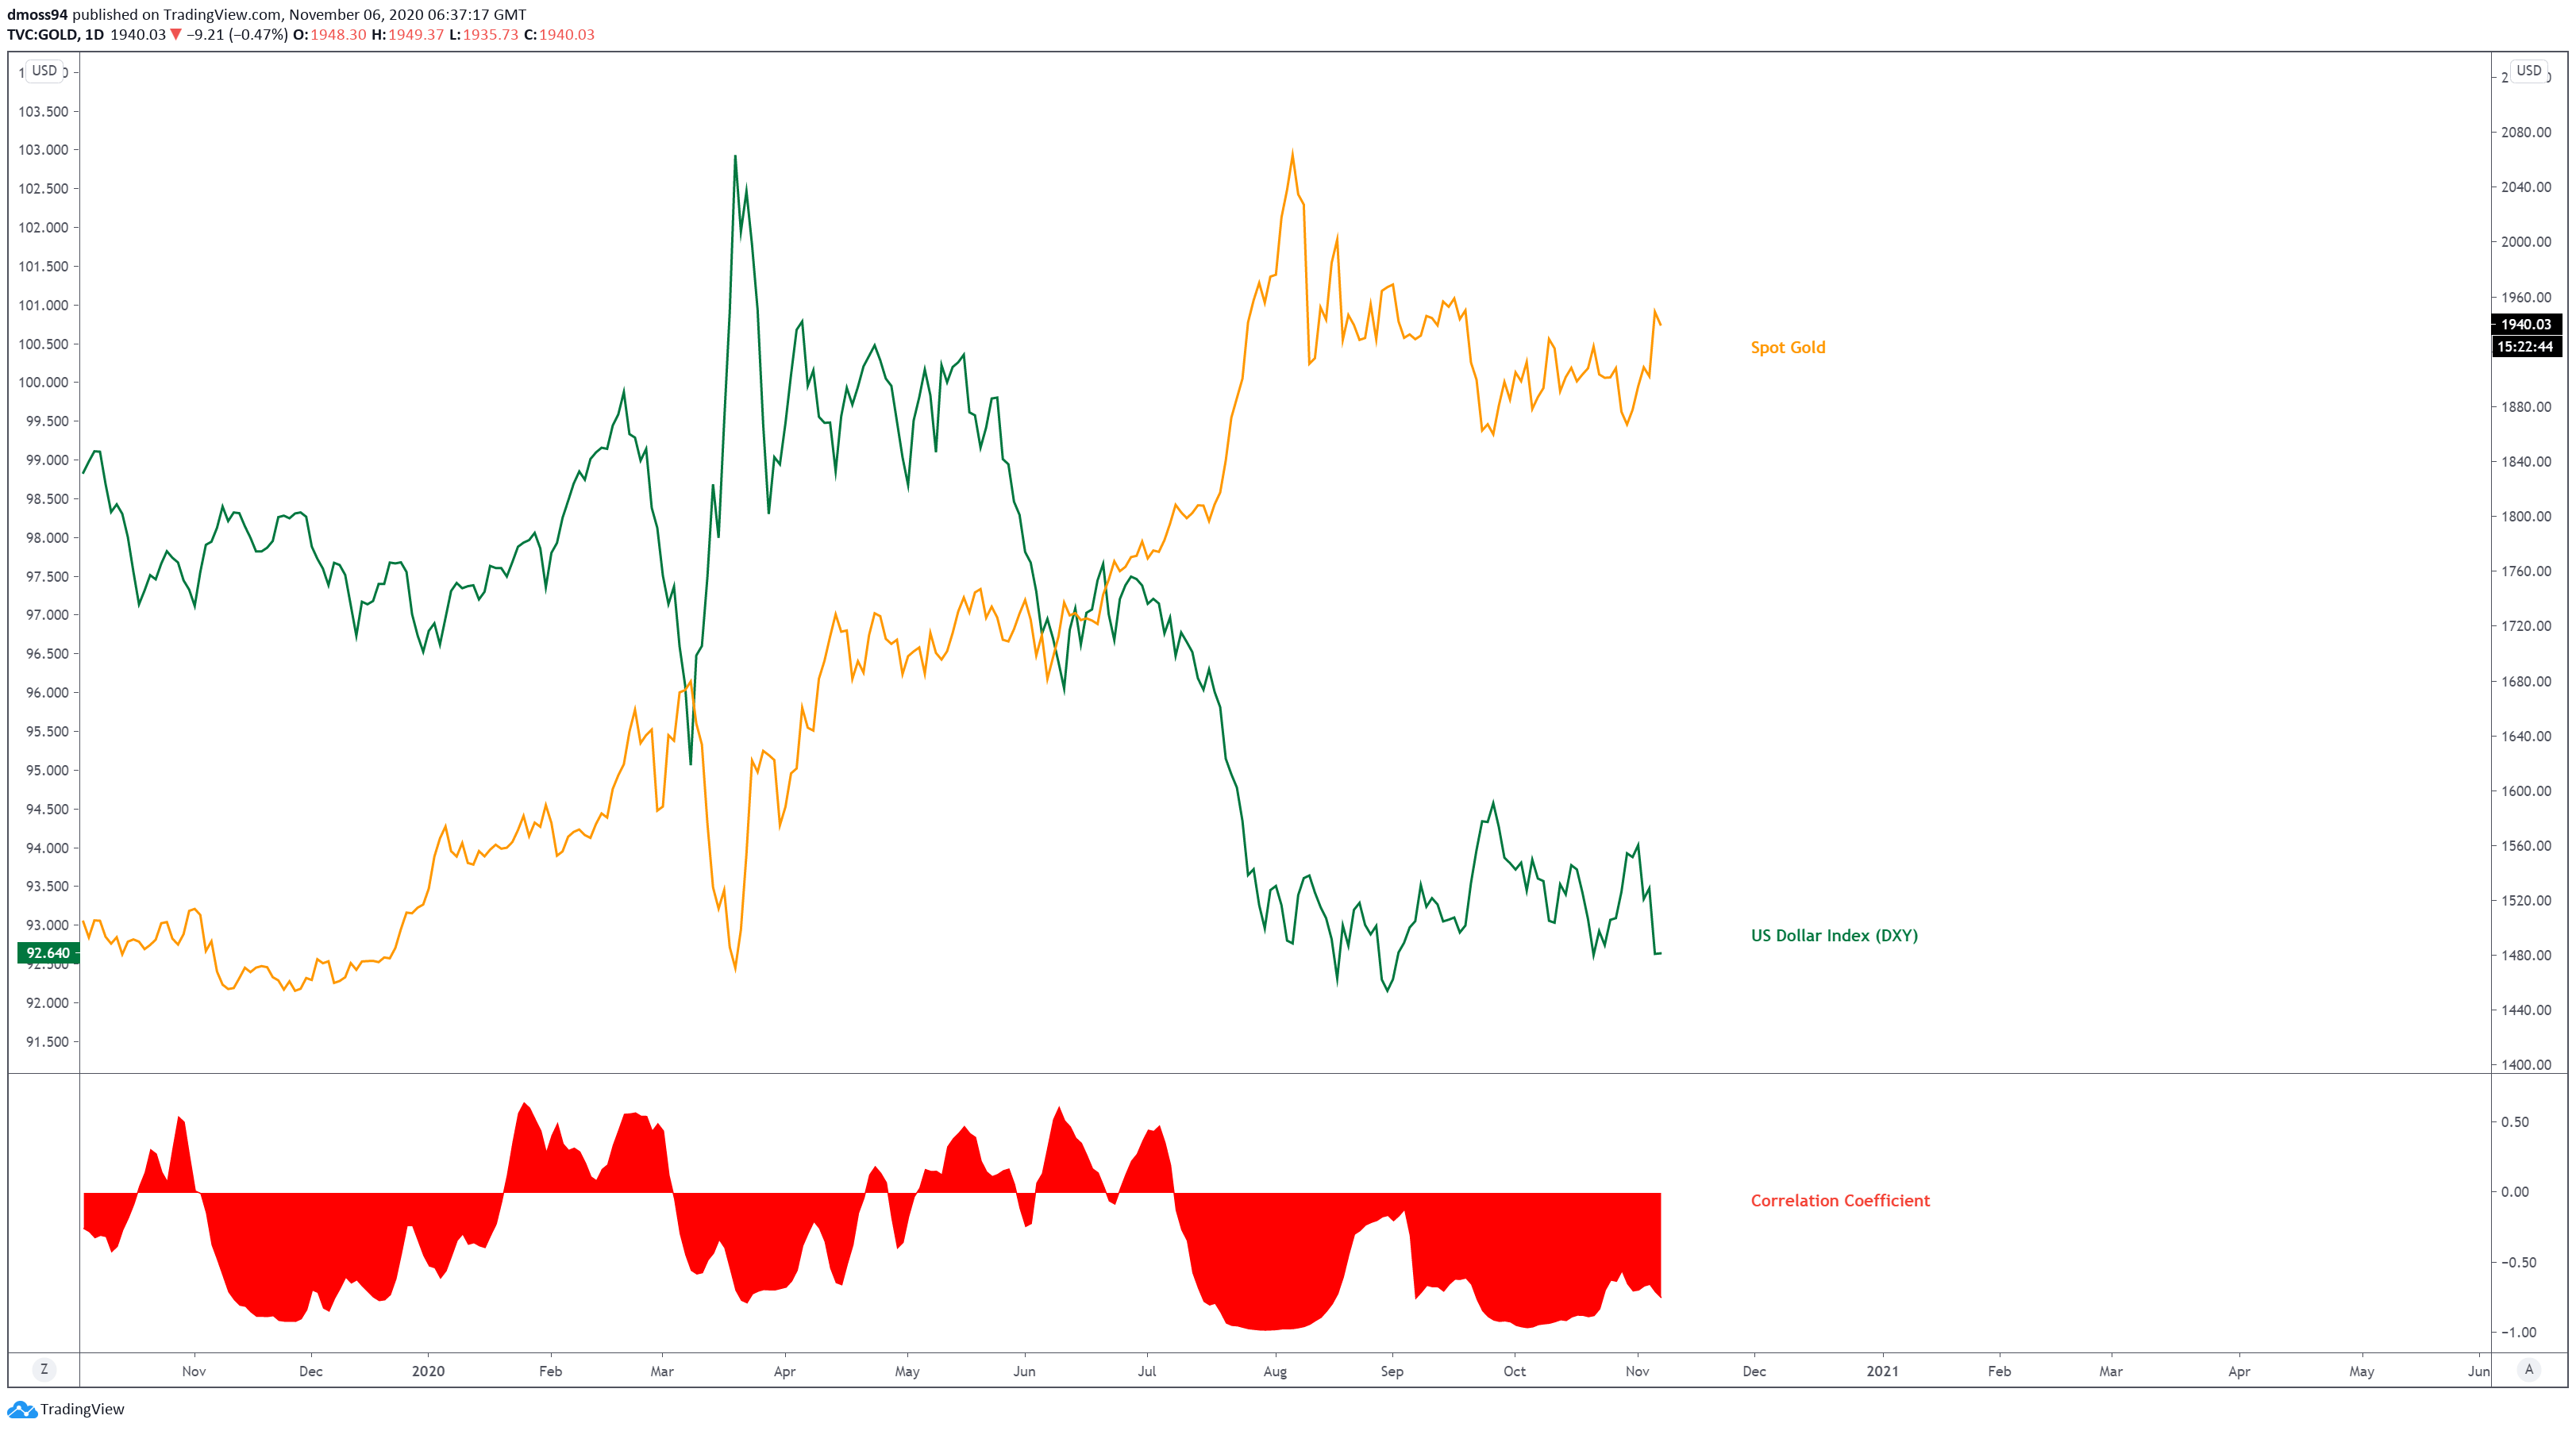
Gold vs USD comparison chart created using TradingView
Blue Wave Unlikely, Not Impossible
An outside chance of a ‘Blue Wave’ scenario – where Democrats control the White House, Senate and the House – may also put a premium on gold prices, as two of the Senate races in Georgia are pushed to January 5 runoffs.
With both seats held by Republican incumbents, an upheaval could swing the balance of power in the Senate to the left, given the GOP currently holds control of 48 seats and are leading in North Carolina and Alaska.
Therefore, if Democratic challengers Jon Ossoff and Raphael Warnock succeed the balance of power in the Senate would be split evenly at 50-50, with a Joe Biden win resulting in Vice Presidential nominee Kamala Harris casting the tiebreaking vote.
To that end, the medium-term outlook for gold may be dictated by the outcome of the Senate race, with a ‘Blue Wave’ expected to bring a substantially larger fiscal aid package and in turn underpinning liquidity-sensitive Bullion prices.
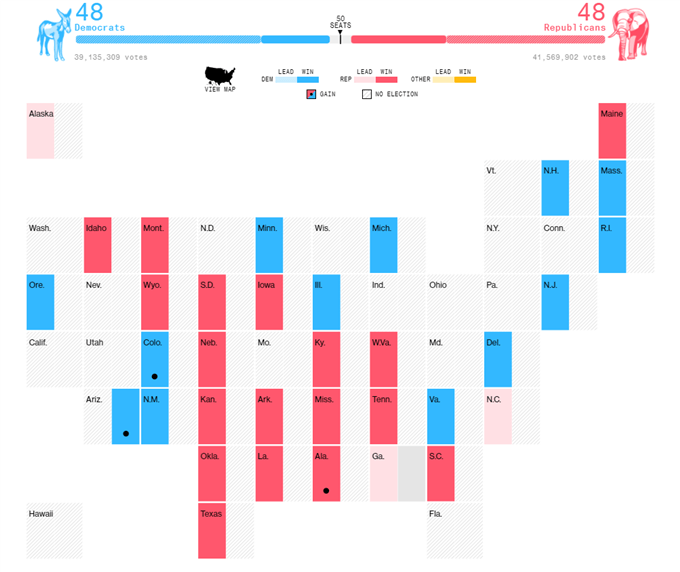
Source – Bloomberg
Dovish FOMC to Underpin Bullion
Finally, dovish commentary from Jerome Powell could stoke easing bets, as the Chairman of the Federal Reserve hinted at a shift in the central bank’s bond purchasing program in the coming months, stating that “at this meeting my colleagues and I discussed our asset purchases [and] the ways in which we can adjust the parameters of it to deliver more accommodation if it turns out to be appropriate”.
Given daily coronavirus cases continue to surge nationally and the central bank’s belief that “the ongoing public health crisis will continue to weigh on economic activity, employment, and inflation in the near term”, additional monetary support looks more than likely. The US became the first country to record over 100,000 new covid-19 infections in 24 hours on Thursday.
Moreover, with the provision of a much-needed fiscal aid package this side of Christmas unlikely and recent employment data showing an unexpected rise in jobless claims, the Federal Reserve may be forced to pick up the slack in the interim.
With that in mind, a disappointing non-farm payrolls report for October may justify the need for the Fed to deliver further accommodation and in turn nurture gold’s push to test the yearly high set in August.
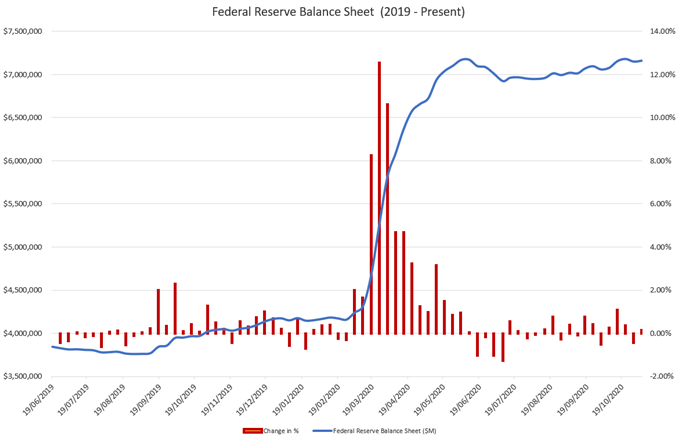
Source – Federal Reserve
Gold Daily Chart – Break of Descending Triangle Hints at Further Upside
From a technical perspective, gold prices look poised to continue pushing higher after breaking above Descending Triangle resistance and clearing the psychologically imposing 1930 mark.
With the MACD indicator bursting back above its neutral midpoint and the RSI climbing above 60 and into bullish territory, the path of least resistance looks to be higher.
Therefore, a daily close above the November 5 high (1952.77) would probably ignite a push to test the 127.2% Fibonacci (2070.14), if buyers can hurdle resistance at the August 27 high (1976.65).
Conversely, a breach of support at the October high (1933.28) could generate a pullback towards the trend-defining 50-day moving average (1905.74) and 1900 level.
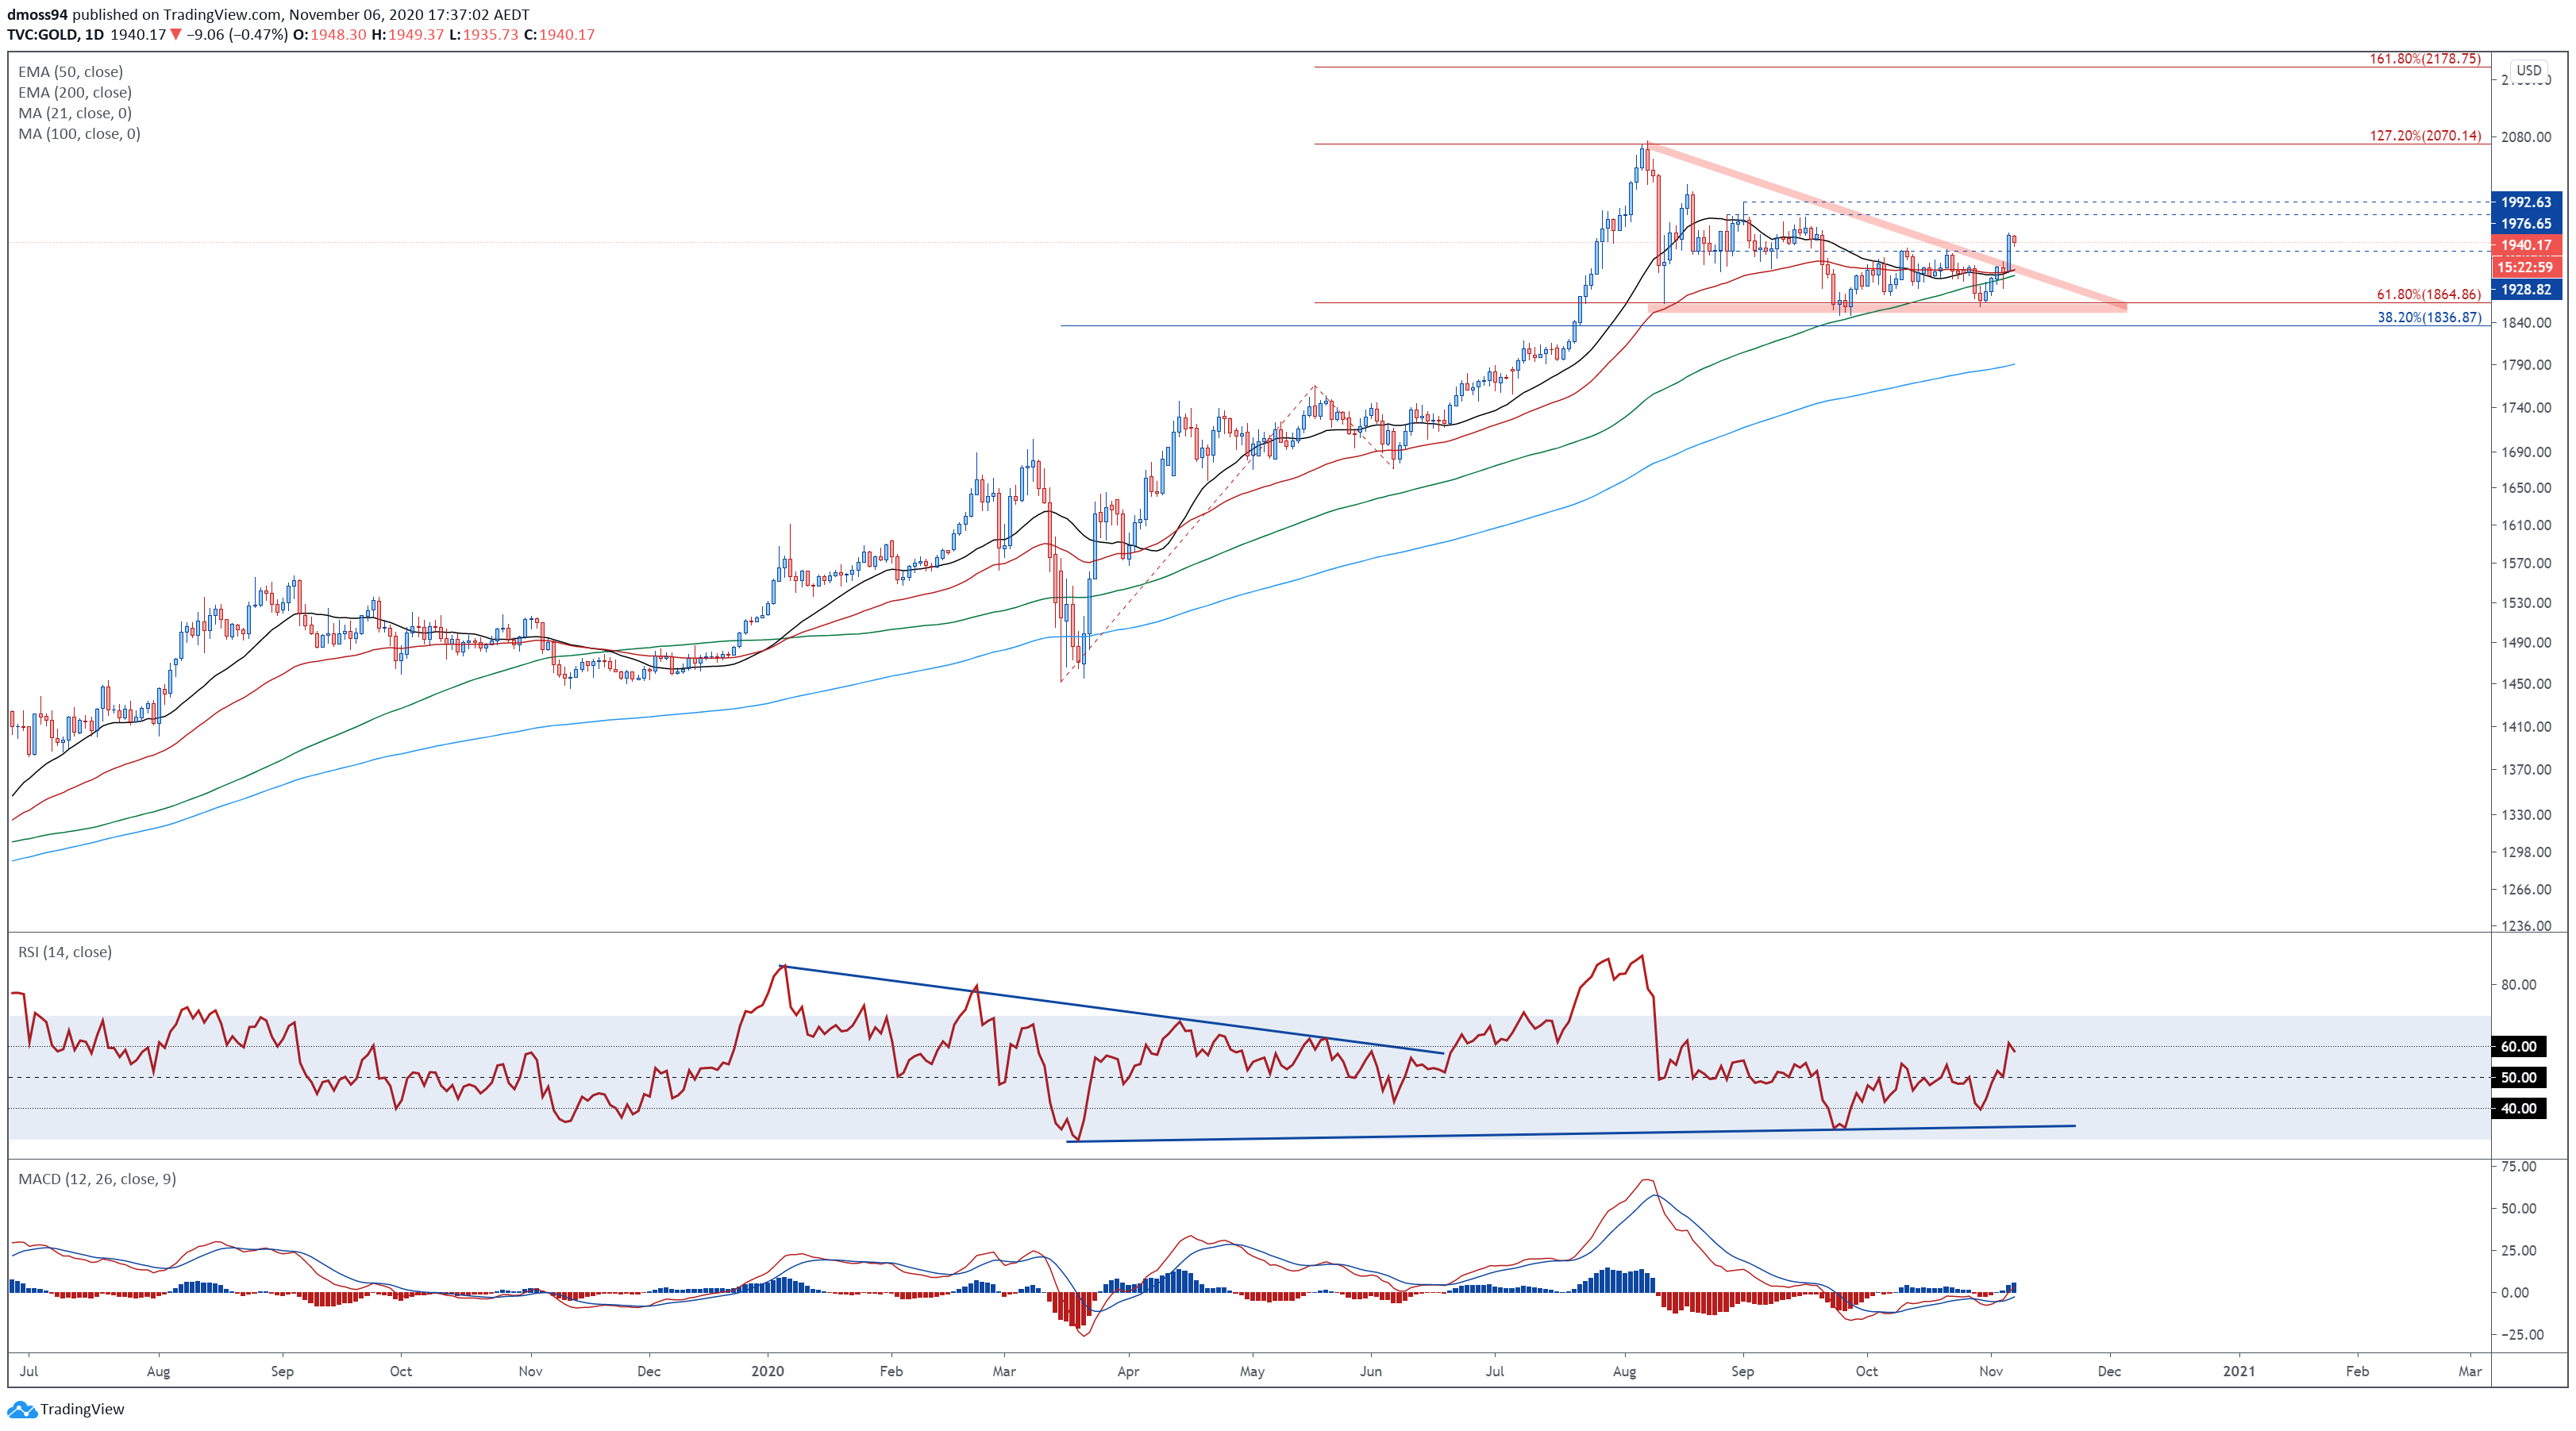
Gold prices daily chart created using TradingView
Gold 4-Hour Chart – Bull Flag in Play
Zooming into a four-hour chart reinforces the bullish outlook seen on the daily timeframe, as gold prices carve out a Bull Flag continuation pattern above key support at the 100% Fibonacci (1938.11).
The development of the RSI and MACD indicator hint at swelling bullish momentum, as both oscillators push to their most extreme intraday levels since early September.
A break above the 127.2% Fibonacci extension (1953.74) would probably ignite a push towards the 161.8% Fibonacci (1973.63), with the bullish continuation pattern’s implied measured move suggesting Bullion could jump back above the 2000 mark to test key resistance at the August 18 high (2015.65).
On the other hand, a close below the 1940 level could generate a short-term pullback towards the October high (1933.28), with a push below bringing the 61.8% Fibonacci (1916.15) into focus.
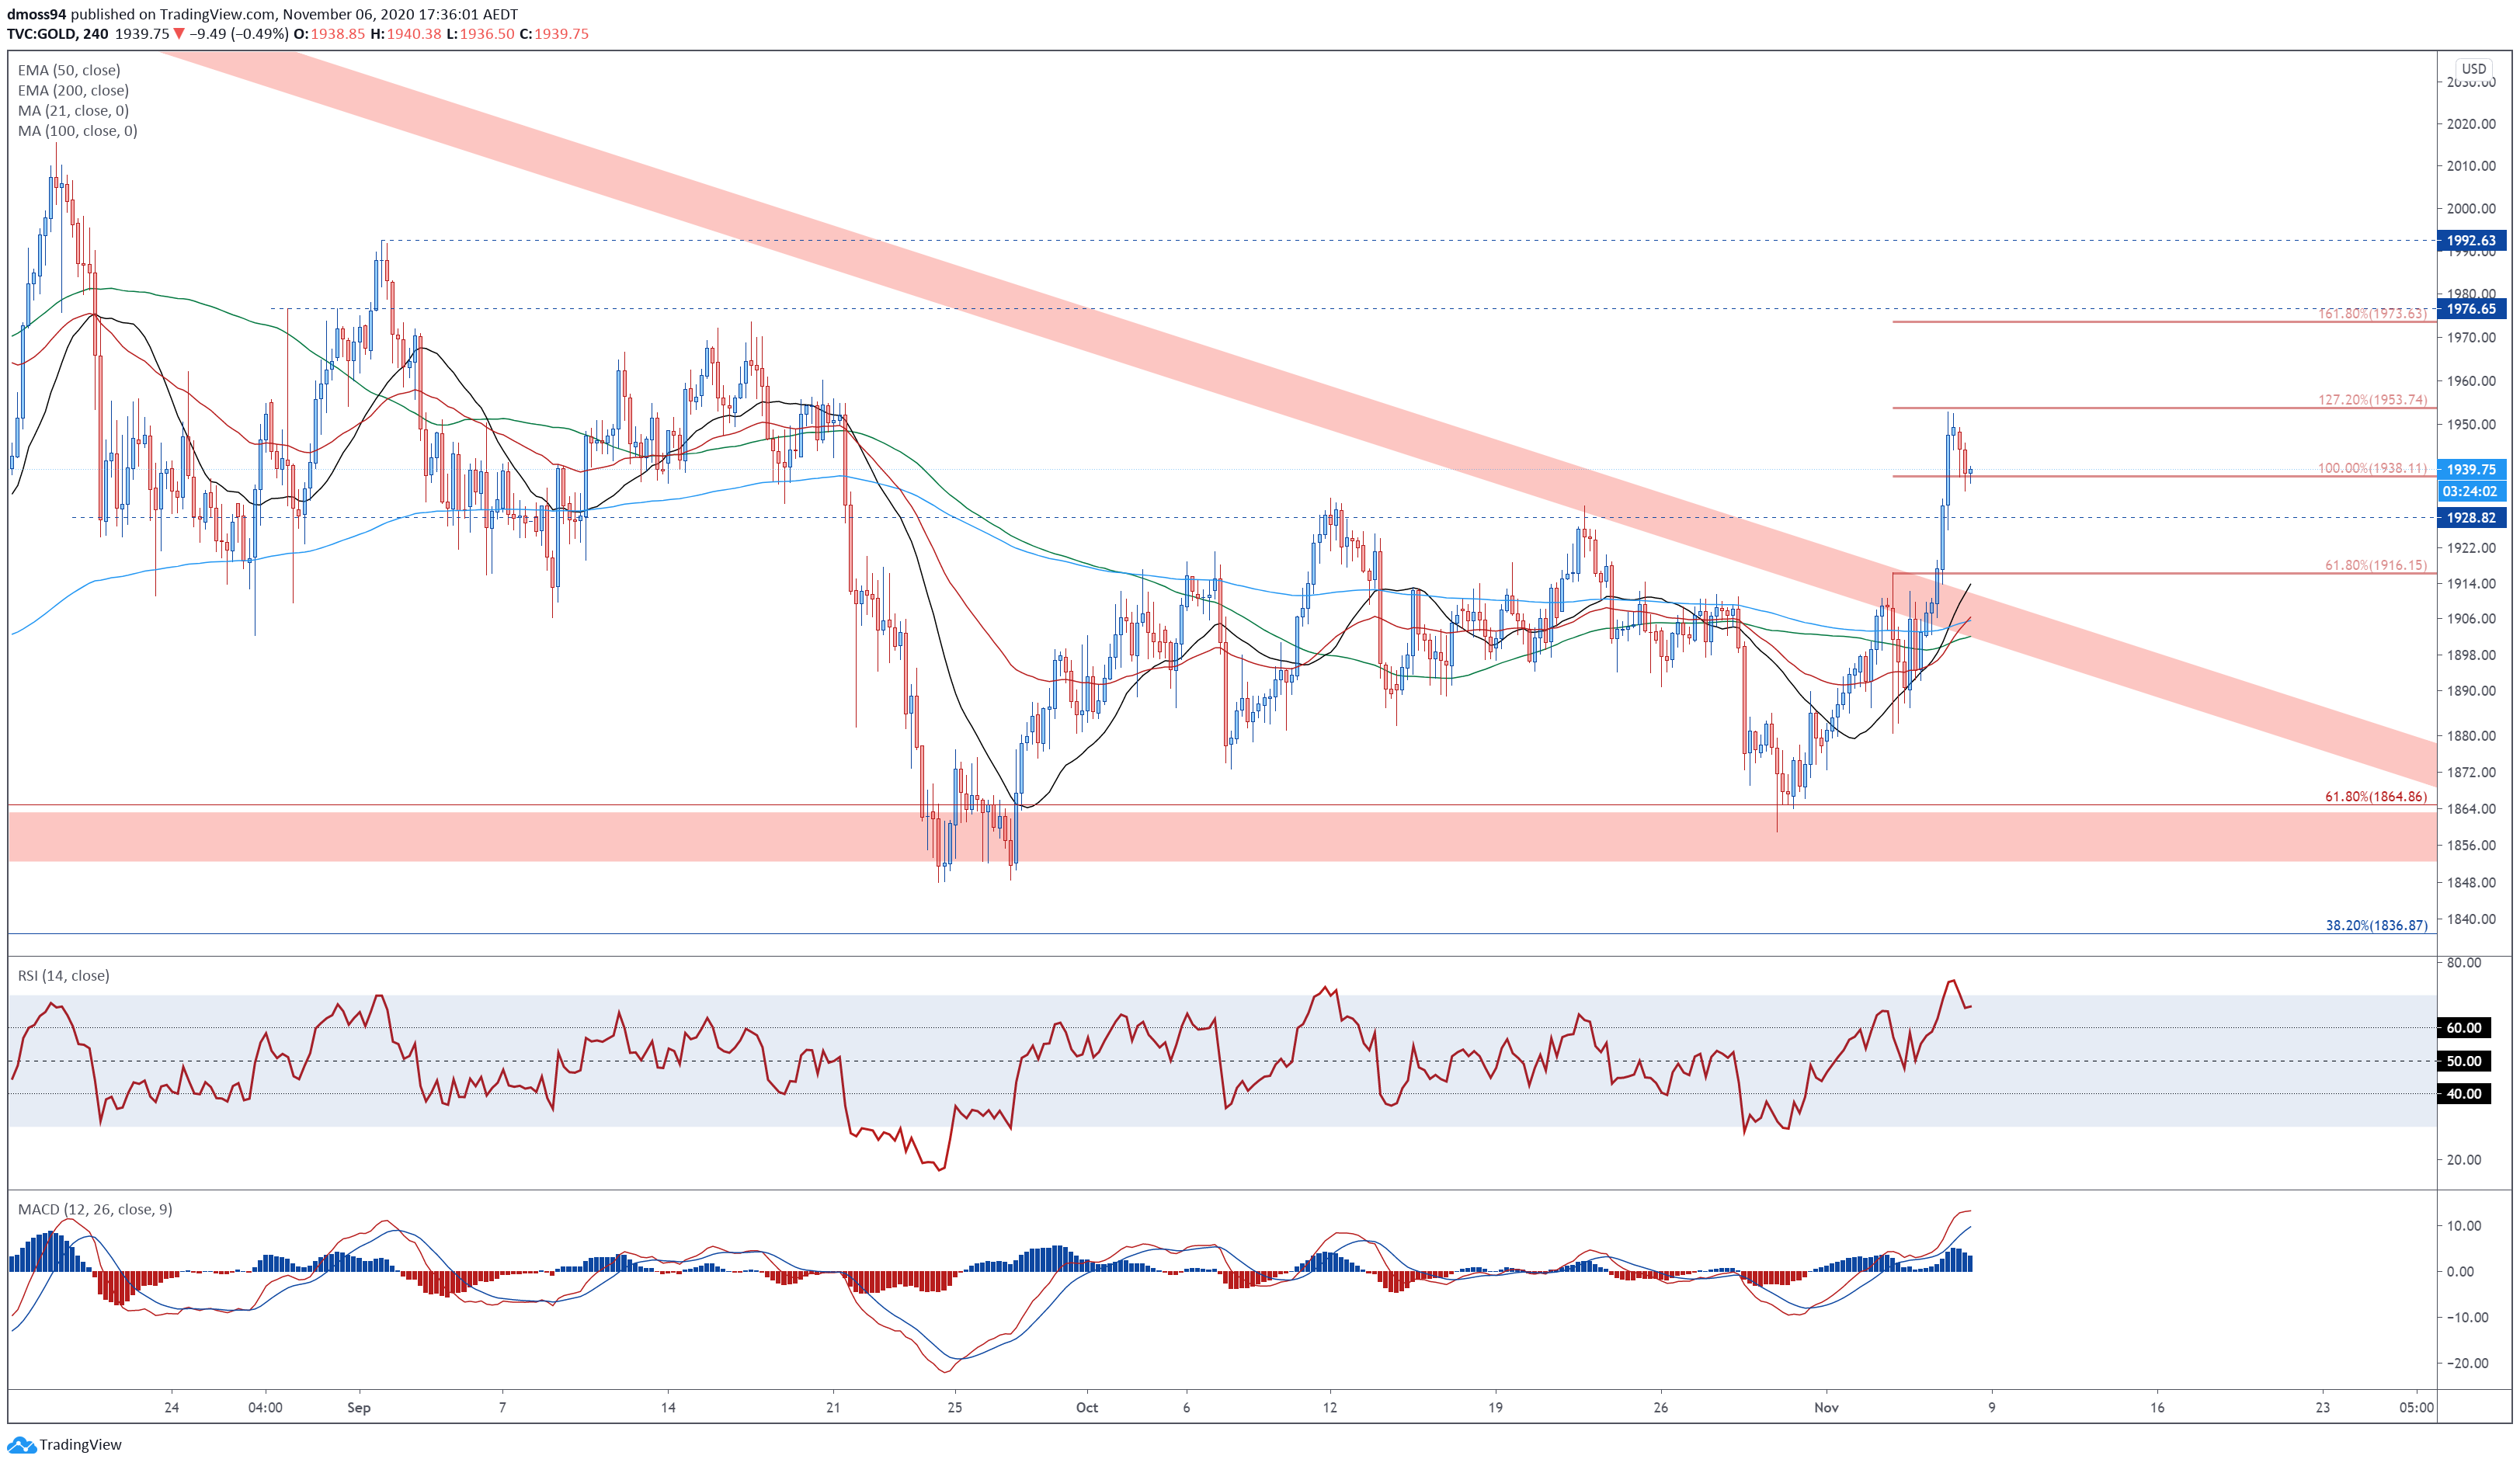
Gold prices 4-hour chart created using TradingView
— Written by Daniel Moss, Analyst for DailyFX
Follow me on Twitter @DanielGMoss

Recommended by Daniel Moss
Improve your trading with IG Client Sentiment Data
|
|
Leave a Reply
You must be logged in to post a comment.