

Japanese Yen, USD/JPY, Intervention, Bank of Japan – Technical Forecast
- Japanese Yen sees most volatile session against US Dollar since 2016
- This followed government intervention to prop up the rapidly falling JPY
- USD/JPY falls under key trendline, will this open the door to more pain?
Recommended by Daniel Dubrovsky
How to Trade USD/JPY
Japanese Yen Sees Most Volatile Trading Day in Over Six Years Amid Intervention
The Japanese Yen gained about 1.22 percent against the US Dollar on Thursday during a volatile 24 hours. This was also the worst performance for USD/JPY since August. More impressively, it was the widest daily trading range in over 6 years! After months of offering nothing more than verbal jabs against their weakening currency, the government intervened in the market to uphold its currency.
This followed another relatively status-quo Bank of Japan interest rate decision, where Governor Haruhiko Kuroda kept benchmark lending rates and yield curve control unchanged. Policymakers also showed no interest in shifting course. As a result, the policy divergence between the Federal Reserve and BoJ widened further. This is a natural recipe for further depreciation in the Japanese currency.
Japan’s market intervention was the first time since 1998, back when the objective was to stem a rapidly strengthening currency. This is opening the door to subdued price action heading into the weekend. Whether or not the government prevails, it is hard to ignore the underlying economic forces that are pressuring the Japanese Yen.
Put another way, intervention could be a sign that the BoJ intends on standing put for some time. Yesterday’s interest rate decision seemed to hint at that. As such, this could be a tough battle. But, Japan has about USD 1.17 trillion in reserves. This could be enough to last through the Fed’s tightening cycle. But, a change in the BoJ’s direction would probably have the most meaningful impact. What are key levels to watch then?
Trade Smarter – Sign up for the DailyFX Newsletter
Receive timely and compelling market commentary from the DailyFX team
Subscribe to Newsletter
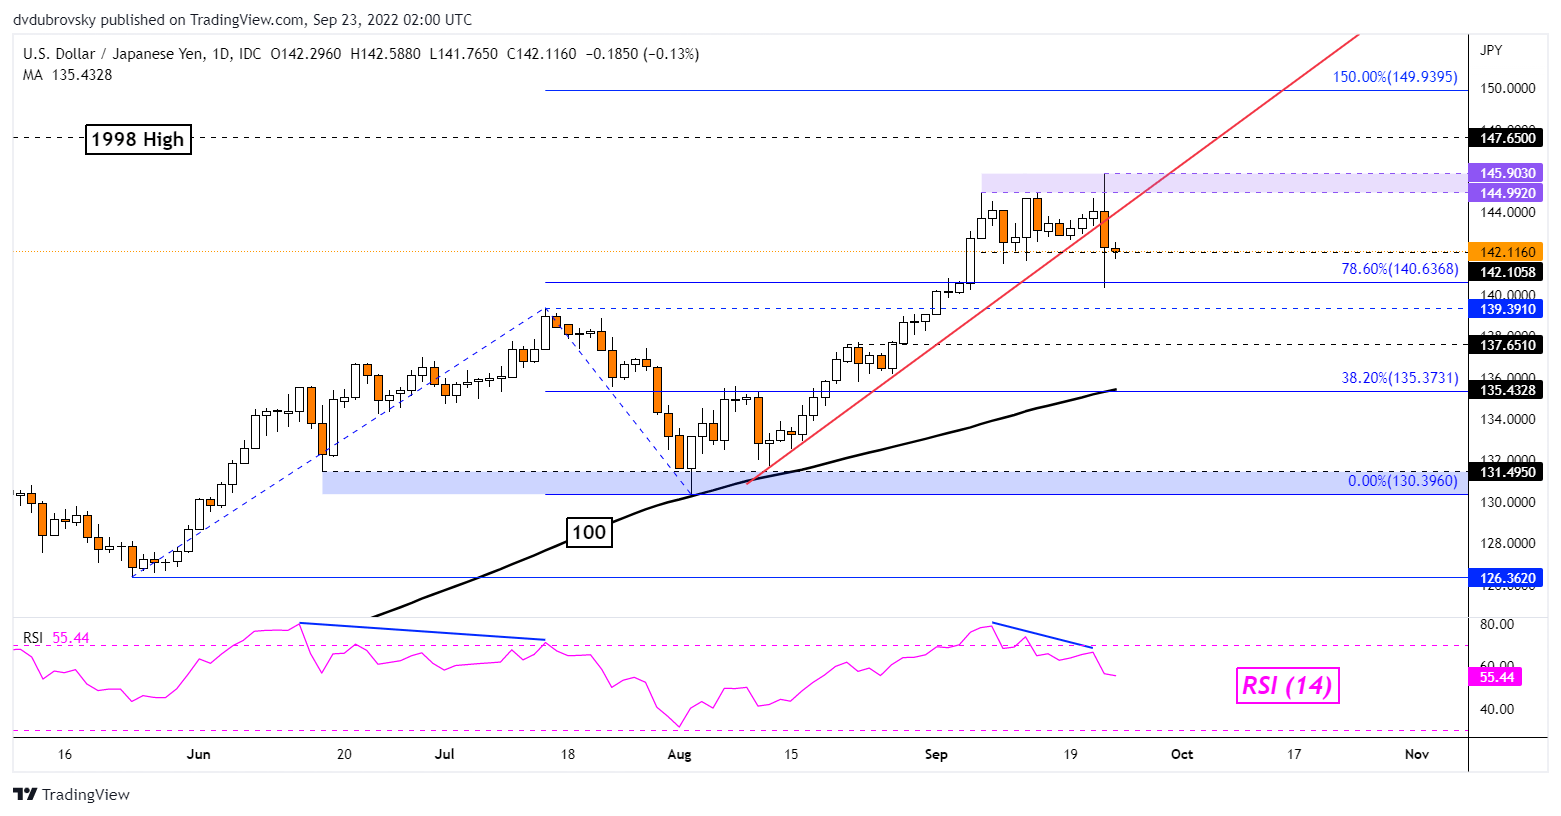
USD/JPY Daily Chart
On the daily chart, USD/JPY was unable to hold a drop through immediate support of around 142.116. A lower wick was left behind as it touched the 78.6% Fibonacci extension at 140.636. Prices closed under the near-term rising trendline from August. Further downside confirmation could open the door to extending losses. But, the 100-day Simple Moving Average (SMA) may hold as support, maintaining the broader upside focus. Key resistance seems to be the 144.99 – 145.90 resistance zone.
— Written by Daniel Dubrovsky, Strategist for DailyFX.com
To contact Daniel, use the comments section below or@ddubrovskyFXon Twitter
|
|
Leave a Reply
You must be logged in to post a comment.