

MEXICAN PESO KEY POINTS:
- USD/MXN price action has remained subdued in the last few days ahead of a key holiday in the United States
- U.S. NFP data on Friday, however, could spark volatility in the FX market
- In this article we analyze the main technical levels to watch in the USD/MXN for the rest of this week
Advertisement
Most read: How does NFP data can affect FX markets and how to trade it smartly?
After the big gain in the Mexican peso provoked by Banxico’s rate hike surprise, volatility has decreased in USD/MXN exchange rate as of last Friday, with price action stuck in the 19.70-19.95 range since that day. The sleep-inducing market condition can be attributed to the quieter summer trading season in the northern hemisphere and the upcoming long weekend in the United States to commemorate Independence Day (investors go on vacation around these days). Many traders are also staying on the sidelines and deliberately avoiding taking large directional positions for fear that a key economic release this week will change the narrative and spark strong volatility.
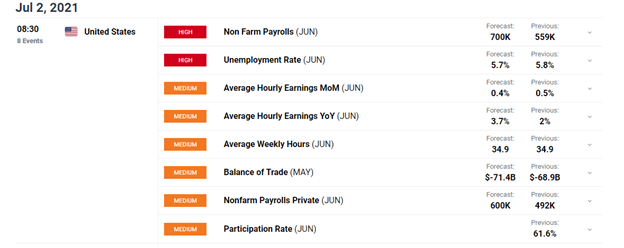
Source: DailyFX Economic Calendar
On Friday, the U.S. Bureau of Labor Statistics will release its June labor market report. Investors expect nonfarm payrolls (NFP) to rise by 700,000, following May’s 559,000 gain. Further economic normalization and progress in vaccinations recorded over that last four weeks, amid strong pent-up demand in the services sector, likely supported hiring and fortified employment growth. The aforementioned, coupled with the solid June ADP private sector payroll results that crossed the wires this morning, suggest that the job numbers could potentially surprise on the upside, despite the ongoing labor supply issues.
Weekly Technical US Dollar Forecast: Rangebound Ahead of June US NFP
According to Wall Street’s whispers, any NFP print close to 1 million or a figure significantly above that mark may reinforce the narrative that the economy is ready to withstand some monetary policy tightening in the form of reduced asset purchases, strengthening the case for a tapering announcement in late summer or early fall. That said, the possibility that the Fed will lay out a QE exit strategy sometime in the next three months may push long-term interest rates higher, boosting the U.S. dollar and triggering an EM FX sell-off. As a result, USD/MXN could spike higher in early July, at least temporarily. Broadly speaking, emerging market currencies are vulnerable to increases in US treasury yields, as these developments can trigger capital outflows from these economies.
Alternatively, if the NFP report comes on the soft side, market skeptics will argue that the economy has not made sufficient progress toward the Fed’s mandate to justify withdrawing stimulus in the near term. This scenario may remove pressure from the Federal Reserve to start normalizing monetary policy soon. With almost three rate hikes expected by the end of 2023, any data disappointment is poised to have a disproportionately large negative impact on US dollar. Needless to say, this scenario may fuel the next leg higher in EM FX and push USD/MXN to new yearly lows.
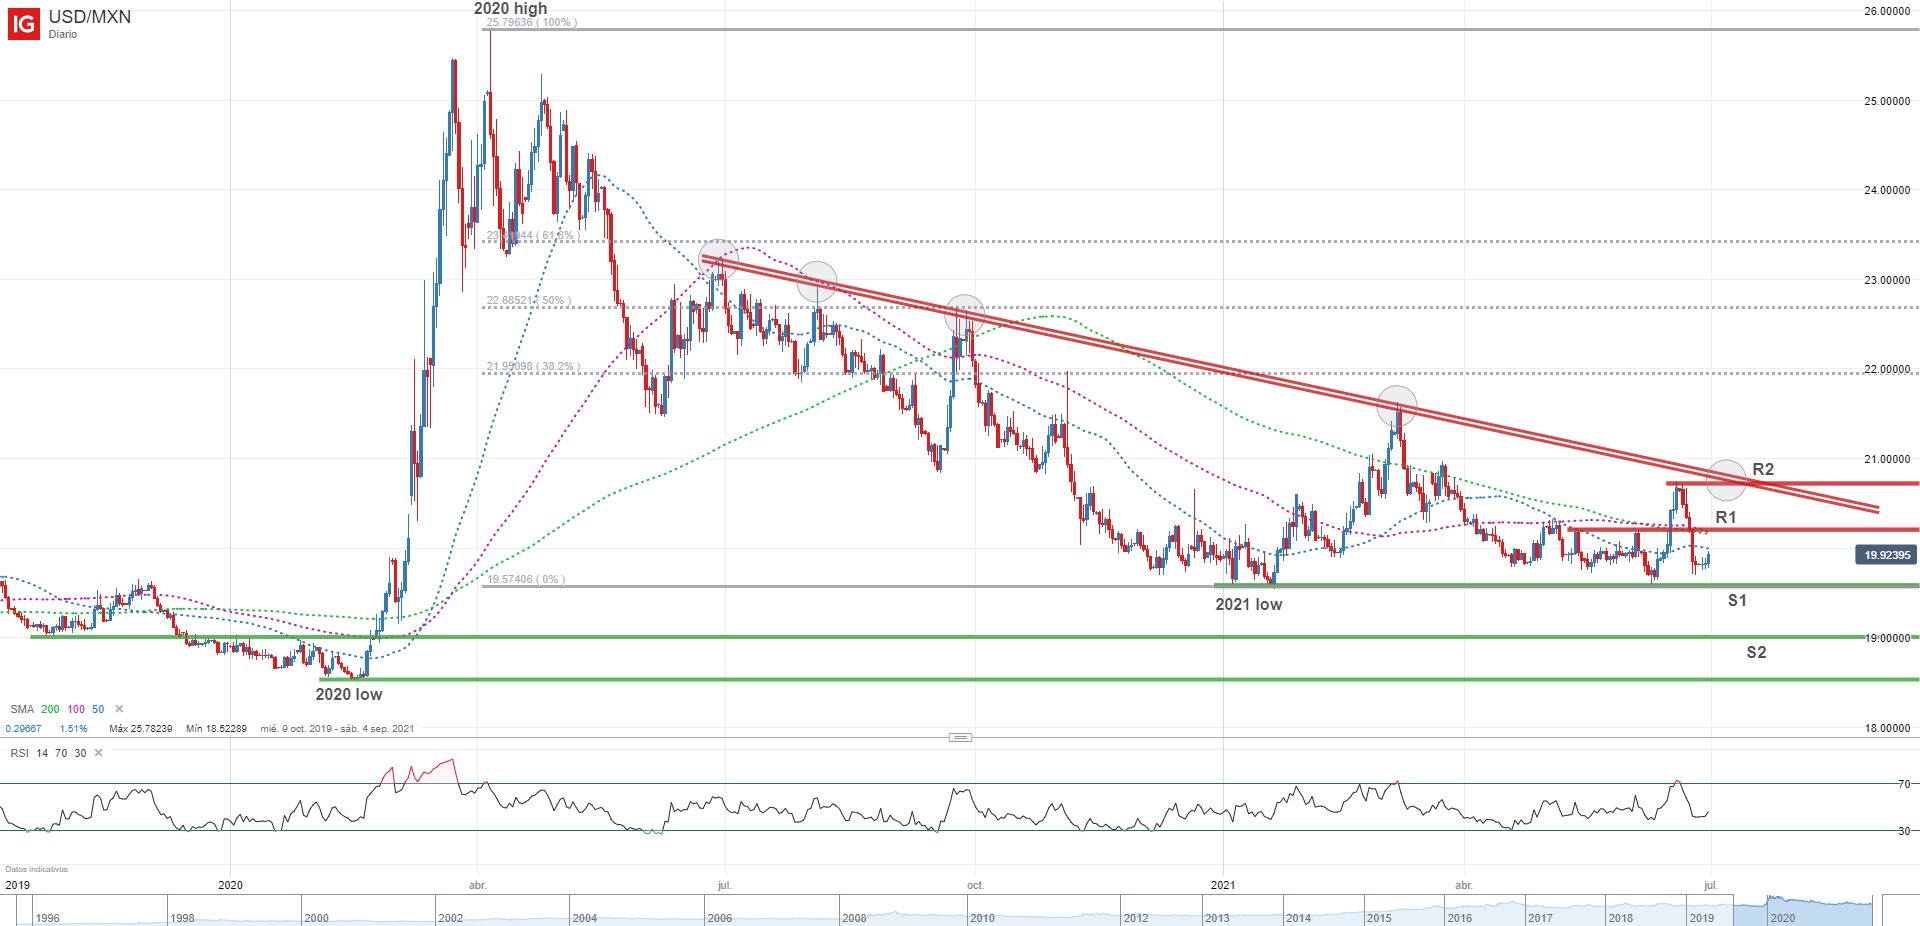
USD/MXN TECHNICAL ANALYSIS
Although there was some wild swings in USD/MXN during a significant part of June (not the last few days), when it was all said and done and the month wrapped up, the pair finished mostly unchanged from its closing price in May, near the 19.95 area. Despite this neutrality, USD/MXN appears biased to the downside over the medium term as it remains below its 200 day moving average and a 12-month descending trendline. However, for price to resume convincingly the next leg lower, we would need to see a decisive break below the 2021 low near 19.55. If sellers manage to push prices below that key support, the 19.00 psychological level would come into focus.
On the flip side, if USD/MXN charges higher and pierces the 20.20 resistance, it would not be surprising to witness a move towards the next technical barrier near the 20.75 mark (see daily chart below).
USD/MXN TECHNICAL CHART
EDUCATION TOOLS FOR TRADERS
—Written by Diego Colman, DailyFX Market Strategist
Follow me on Twitter: @DColmanFX
|
|
Leave a Reply
You must be logged in to post a comment.