

Gold, Silver, Janet Yellen, US Real Yields, XAU/USD, XAG/USD – Talking Points:
- Precious metal prices may continue to outperform in the coming months on the back of fiscal stimulus hopes and falling real yields.
- Gold poised to extend recent gains after clambering back above the trend-defining 50-MA.
- Breach of Descending Triangle pattern hints at further upside for silver prices.
Advertisement
Gold and silver prices have recovered lost ground in recent days, climbing 3.8% and 7.6% from their respective monthly lows on the back of falling real yields and a weaker US Dollar. This push higher in precious metal prices looks set to endure in the near term, as President Joe Biden’s pick for Treasury Secretary Janet Yellen pushes for additional deficit spending to bolster the nation’s nascent economic recovery.
The former Federal Reserve Chair stressed that “the most important thing we can do is to defeat the pandemic, to provide relief to American people and to make long-term investments that make the economy grow and benefit future generations”.
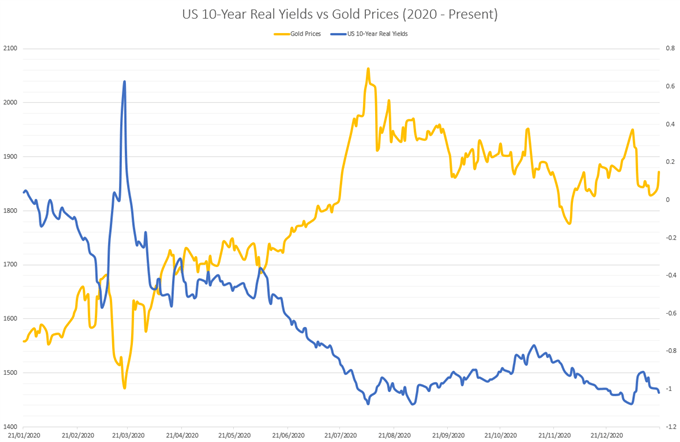
Data Source – Bloomberg
Yellen also stated that she believes “the future is likely to bring low-interest rates for a long time”, adding that “in a very low interest-rate environment like we’re in, what we’re seeing is that even though the amount of debt relative to the economy has gone up, the interest burden hasn’t”.
This appears to be an attempt to convince Senate Republicans that the government’s swelling debt load is not a reason to pull back on additional spending. Indeed, Yellen warned that avoiding “doing what we need to do now to address the pandemic and the economic damage that its causing, would likely leave us in a worse place fiscally”.
Therefore, the intensifying push for additional fiscal support, in tandem with falling real rates of return and climbing inflation expectations, may continue to put a premium on gold and silver in the coming months.
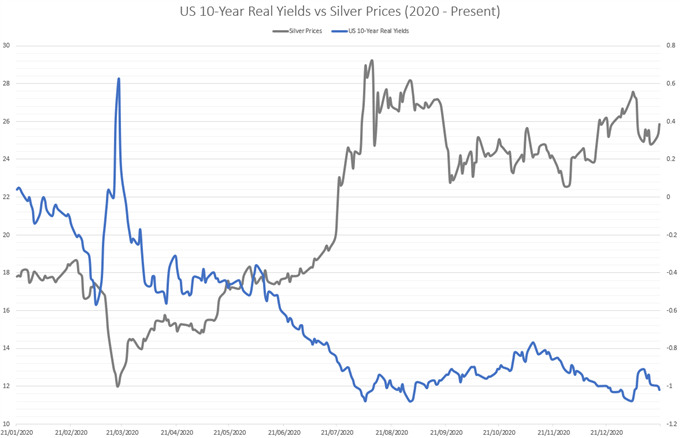
Data Source – Bloomberg
Gold Price Daily Chart – Path of Least Resistance Skewed to the Upside
From a technical perspective, anti-fiat bullion looks set to extend its recent push higher as a Bullish Hammer reversal candle forms above range support at 1820 – 1824 and prices burst away from key uptrend support extending from the March 2020 lows.
With the MACD gearing up to cross above its ‘slower’ signal line counterpart, and the RSI climbing back above its neutral midpoint, the path of least resistance seems to favour the upside.
Remaining constructively positioned above former resistance-turned-support at the January 12 high (1863.9) would probably allow buyers to probe the 100-DMA (1884) and Descending Channel resistance. Clearing that likely intensifies buying pressure in the near term and carves a path to retest range resistance at 1960 – 1965.
Alternatively, sliding back below the trend-defining 50-DMA (1858) could trigger a pullback to 10-month trend support and the 200-DMA (1844). Breaching that probably opens the door for sellers to drive price back to psychological support at 1800.

Gold price daily chart created using Tradingview
Silver Price Daily Chart – Descending Triangle Breach Hints at Extended Gains
Silver also appears poised to significantly push higher in the medium term, after validating the topside break of a 5-month Descending Triangle pattern.
With the RSI and MACD indicator both tracking comfortably above their respective neutral midpoints, and price hovering above all six moving averages, further gains looks likely.
A daily close above psychological resistance at 26.00 may propel prices back towards the monthly high (27.92), with a convincing thrust through that bringing range resistance at 28.50 – 29.00 into the crosshairs.
The Ascending Triangle’s implied measured move suggesting that prices could climb an additional 20% from current levels to challenge the 61.8% Fibonacci (32.92).
On the other hand, a pullback towards the monthly low (24.06) could be on the cards, if the 26.00 mark remains intact.
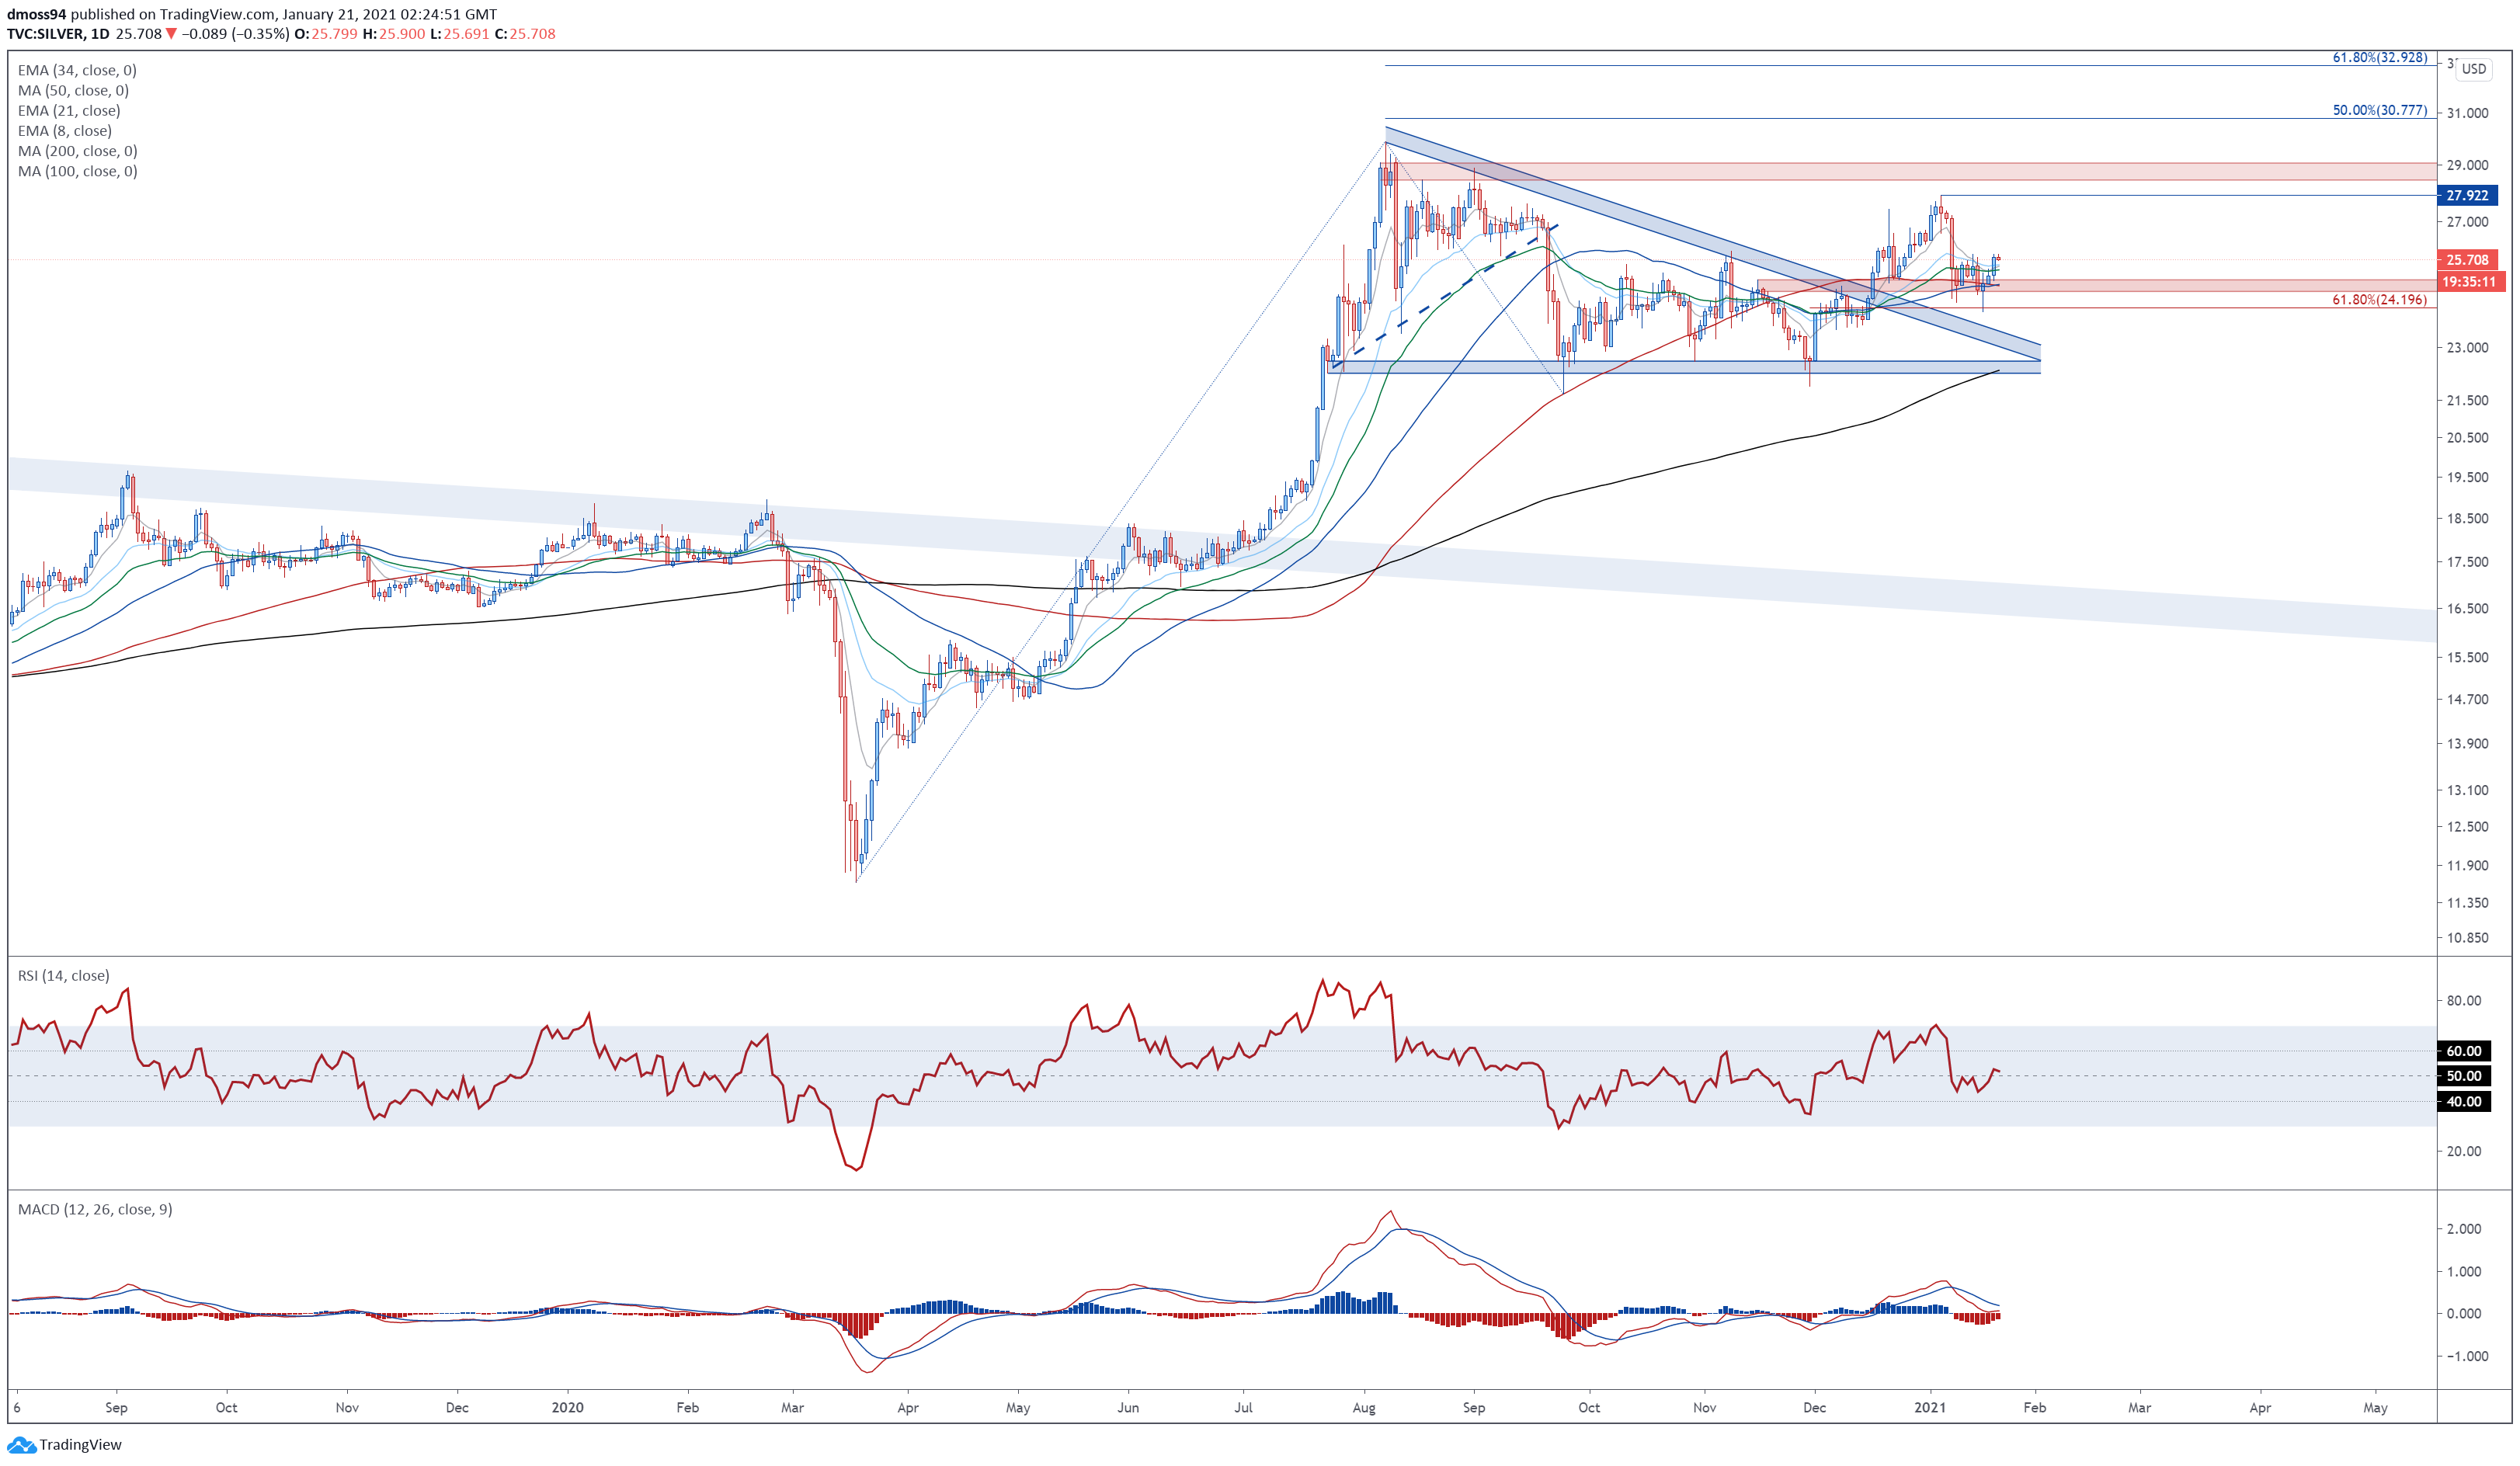
Silver price daily chart created using Tradingview
— Written by Daniel Moss, Analyst for DailyFX
Follow me on Twitter @DanielGMoss

Recommended by Daniel Moss
Traits of Successful Traders
|
|
Leave a Reply
You must be logged in to post a comment.