

ZAR PRICE ACTION TALKING POINTS:
- South African Rand continues to show strength with several macroeconomic tail winds in support
- USD/ZAR approaches 200-day Moving Average (MA) after breaking below 17.0000
- Possible bullish cross looming for GBP/ZAR
- EUR/ZAR trading at monthly lows
- South African inflationary data around the corner
- Global markets to keep a close eye on upcoming Jackson Hole Symposium
SUPPORTIVE MARKET ENVIRONMENT FOR EMERGING MARKET CURRENCIES
Recent resilience show by the South African Rand (ZAR) has continued spurred on by the passing of a COVID-19 drug by the US regulators. Risk seeking investors cheered as Emerging Market (EM) currencies saw large favorable swings.
With the South African government recently easing lockdown restrictions despite ballooning virus figures, the economy needed assistance sooner rather than later. Being a developing nation, South Africa may not rebound to pre-pandemic levels as easily as more developed nations around the world. Although stimulus measures are in place, corruption and political instability still plagues the lives of ordinary citizens.
The strong Rand has not done exporters any favors which is not ideal for economic growth. With the manufacturing sector operating at depressed levels, the support of local industries has been hit hard.
Moving deeper into Q3, ZAR price action seems to be the result of by external global factors – primarily the US Dollar puppeteer. The US is under the spotlight on various fronts such as US elections, Jackson Hole Symposium and US-China tensions. These events can have widespread ramifications for global currencies. ZAR bulls are enjoying the current risk on sentiment but for how long?
Visit the DailyFX Educational Center to discover more on why news events are essential to FX fundamental analysis
ZAR TECHNICAL ANALYSIS
USD/ZAR: Daily Chart
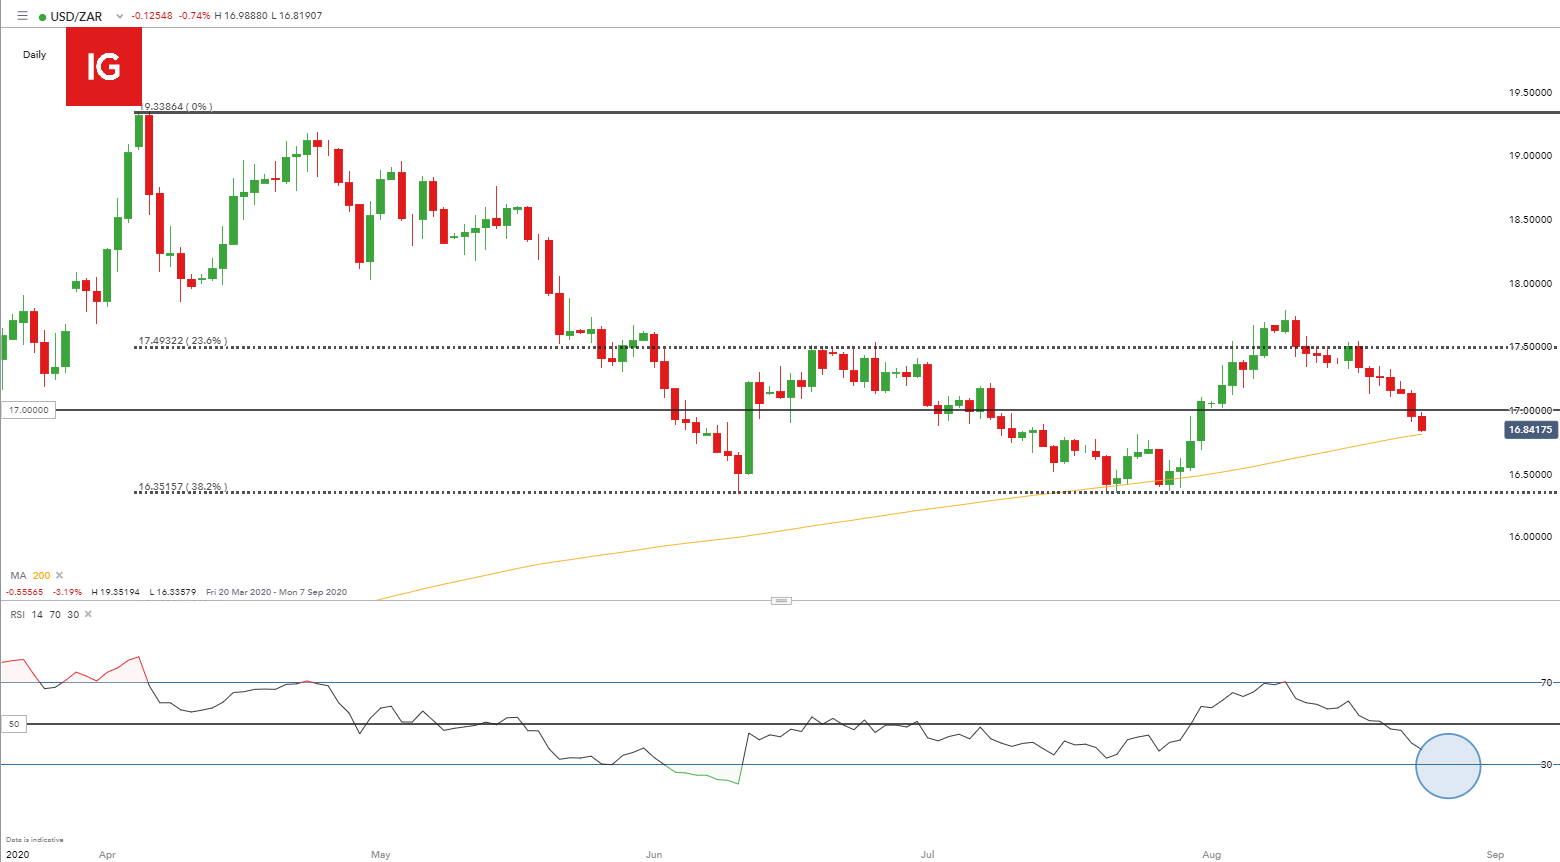
Chart prepared by Warren Venketas, IG
With seven straight days of bearish candles on USD/ZAR, price has managed to break below the 17.0000 psychological level with some conviction. Support targets mentioned in my previous USD/ZAR analysis article has since been met and surpassed. The 200-day Moving Average (MA) (yellow) may provide the next level of support before 16.5000 is targeted. Price is currently trading above the 200-day Moving Average (MA) which suggests the longer term trend is still bullish so a break below will be significant as it may point toward a shift in long term momentum.
Traders looking for a near term reversal may look at a potential bounce off the 200-day MA which could coincide with oversold territory on the Relative Strength Index (RSI) highlighted in blue.
Starts in:
Live now:
Sep 01
( 17:09 GMT )

Keep up to date with price action setups!
Trading Price Action
GBP/ZAR: Daily Chart

Chart prepared by Warren Venketas, IG
The 22.0903 (23.6% Fibonacci level) on GBP/ZAR is proving to be an area of support which bulls are defending as evident by the today’s lower wick. Highlighted in yellow reflects the potential for a bullish cross with the 50-day MA (black) crossing above the 100-day MA (red) in the next few days. Technical analysts see this as an indication of upward momentum.
Keep up to date with your indicators via our Technical Indicator Toolbox
If short-term price movement does reverse to the upside, traders will look for resistance at the upper diagonal trendline (blue) making up the medium term triangle formation. Alternatively, further downward pressure may see a break below the 22.0000 and subsequently the 50-day and 100-day MA lines.

Recommended by Warren Venketas
Building Confidence in Trading
EUR/ZAR: Daily Chart
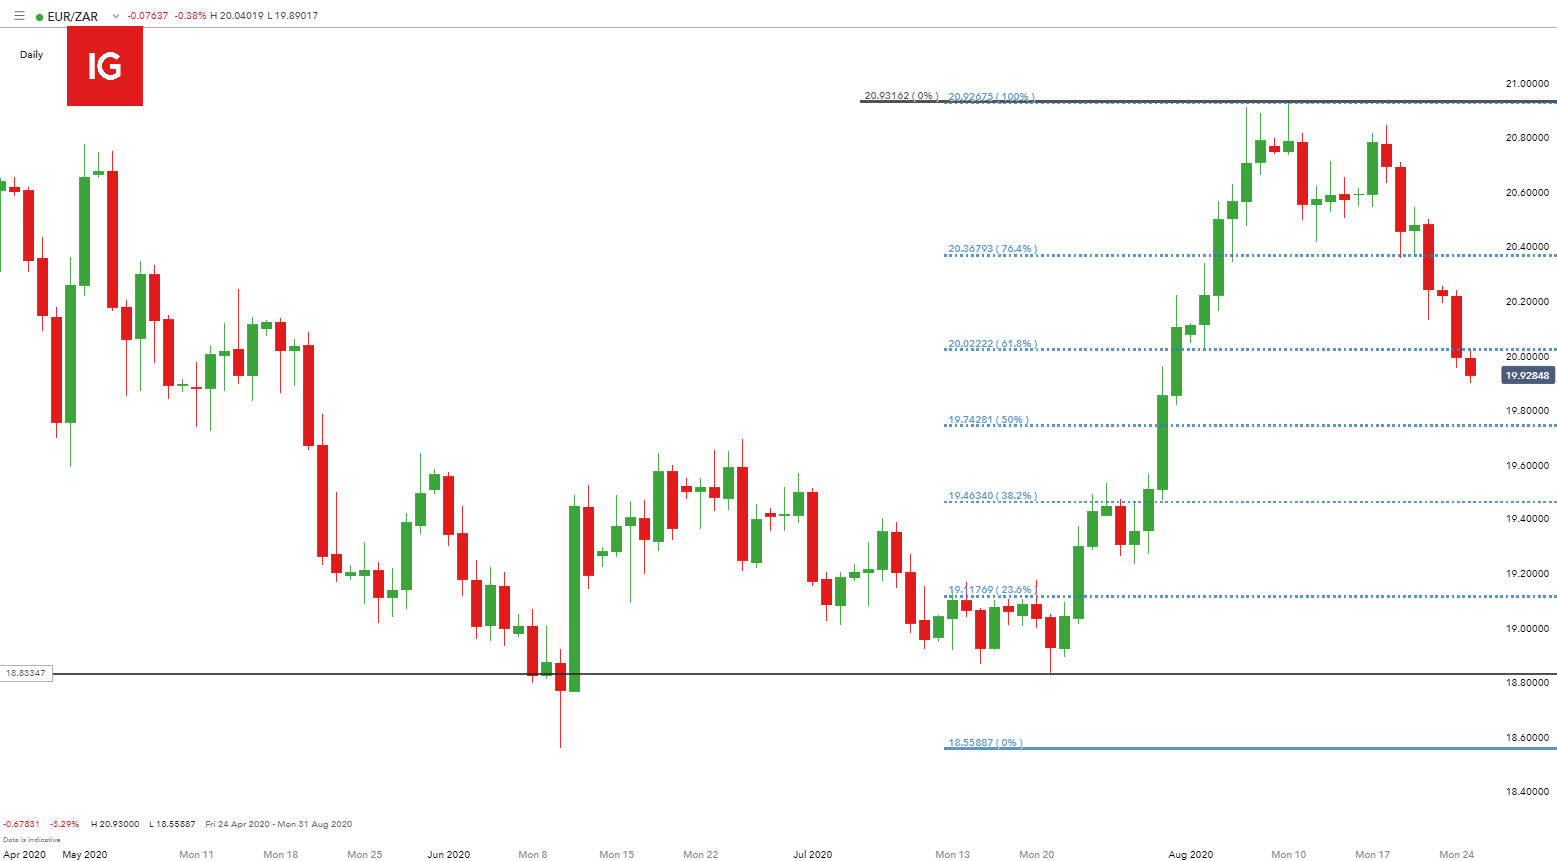
Chart prepared by Warren Venketas, IG
Like the USD/ZAR, EUR/ZAR has pushed below a key horizontal level if 20.0000 which overlapped with the 61.8% Fibonacci level. The sharp downturn exhibits strong downward momentum which may continue toward the 19.7428 (50% Fibonacci level). A strong reversal to the upside is unlikely in the short-term so traders looking for long positions should remain cautious.
CPI AND PPI IN THE SPOTLIGHT
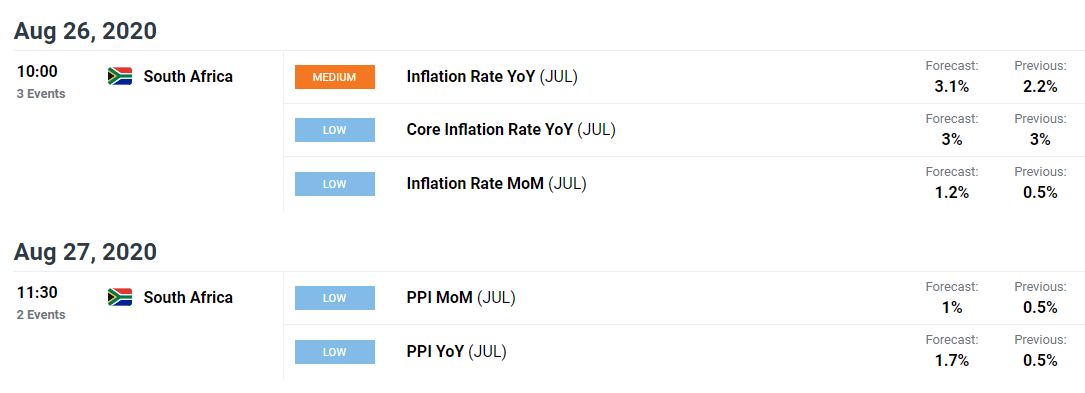
South African inflationary figures for July are due to release on Wednesday and Thursday this week at 10:00 GMT+2 and 11:30 GMT+2 respectively (see economic calendar above). Forecasted figures are expectedly higher due lesser lockdown restrictions. ZAR traders will need to monitor the data releases for any major deviation from forecasts which could impact ZAR price action.

Recommended by Warren Venketas
Learn more on how to trade the news!
JACKSON HOLE SYMPOSIUM: WHAT TO LOOK FOR?
This Thursday and Friday sees the much awaited Jackson Hole Symposium which brings together economists, media, financial market contributors and US government officials to converse on longer-term policy issues. This ‘discussion’ may not seem like something to keep an eye on but past symposiums have resulted in major applied policies.
With interest rates being the center of attention the world over, consideration will most likely be given to the low interest rate environment along with stubborn inflation rates which remain muted. Any changes in current interest rate and inflationary outlook may have systemic effects across financial markets including ZAR crosses so it would be prudent to regularly monitor discussions.
ZAR STRATEGY MOVING FORWARD
The Rand remains in a strong position but upcoming economic data and US influences may provide a catalyst to further downside or the potential for a reversal across majors if risk aversion sets in. Looking at the next few months, US elections are expected to bring with it an increase in volatility which could see investors seek safe-haven currencies which could put a damper on ZAR gains. Key trading points to consider:
- Technical analysis – USD/ZAR: 200-day MA; GBP/ZAR: MA crossover; EUR/ZAR: 19.7428 Fibonacci level
- Local CPI and PPI data
- Jackson Hole Symposium
— Written by Warren Venketas for DailyFX.com
Contact and follow Warren on Twitter: @WVenketas
|
|
Leave a Reply
You must be logged in to post a comment.