

S&P 500, HANG SENG, ASX 200, ASIA-PACIFIC MARKET OUTLOOK:
- S&P 500 and Nasdaq Composite retreated for a second day as yields climbed
- Initial jobless claims data disappointed, denting market sentiment
- Hang Seng Index (HIS) retreated sharply from a 2.5-year high as mainland investors returned from a holiday break

Recommended by Margaret Yang, CFA
Get Your Free Equities Forecast
Wall Street, Yields, Jobless Claims, Crude Oil, Asia-Pacific Stocks Outlook:
Disappointing jobless claims data and a resurgence in US Treasury yields fueled broad profit-taking activity on Wall Street overnight, with the Dow Jones, S&P 500 and Nasdaq Composite falling -0.38%, -0.44% and -0.72% respectively. Weekly jobless claims surged to 861k in the week ending February 13th, higher than the baseline forecast of a 765k increase. Last week’s reading was revised up by 55k to 848k. These reflected softer labor market conditions in early February after vaccine rollouts brought the unemployment benefit claims down in January.
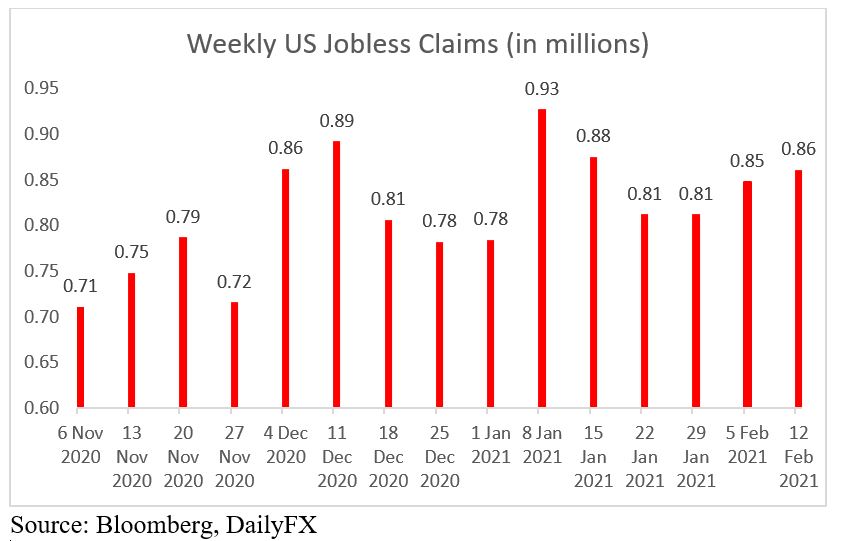
Source: Bloomberg, DailyFX
Meanwhile, the 10-year Treasury yield resurged to above 1.30% before paring some gains. Higher yields imply a rising cost of borrowing and thus serve to undermine risk assets. Equity valuations also become lower when future cash flow streams are discounted back at higher required rates of return. As such, rich-valued global equities, especially the technology sector, may see a temporary pullback should yields continue to climb in the near future.
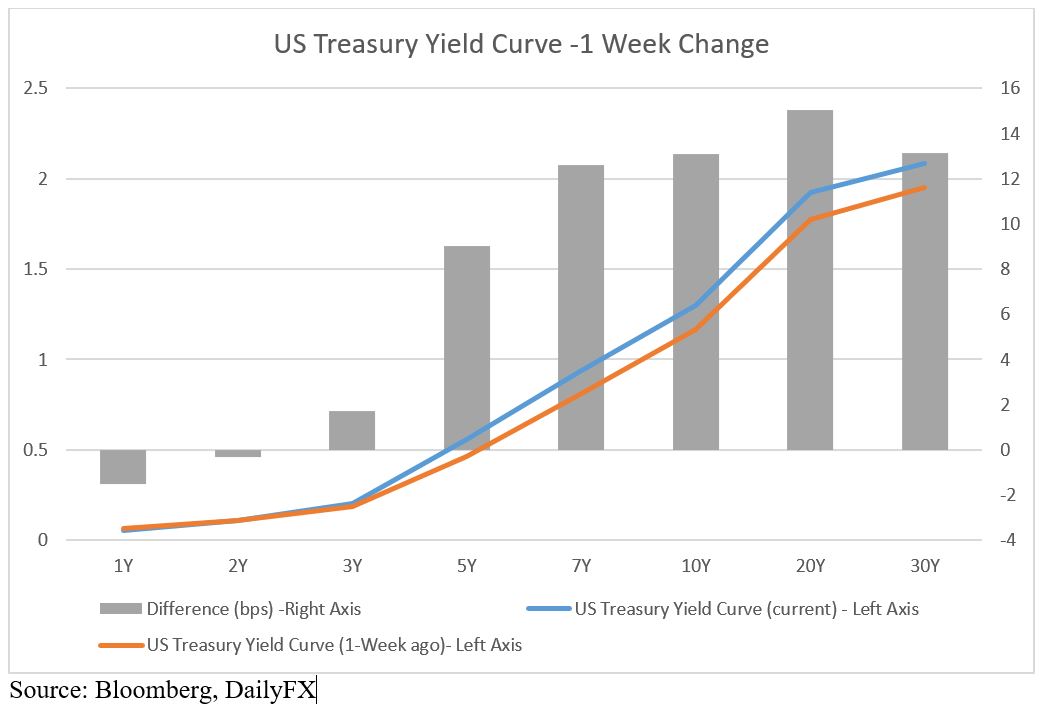
Source: Bloomberg, DailyFX
Asia-Pacific markets are poised to open broadly lower, extending a two-day decline amid souring sentiment. The Hang Seng Index (HIS) plunged 1.58% on Thursday, falling from a 2.5 year high of 31,084 as mainland investors returned from a week-long holiday break. Sentiment in mainland Chinese bourses swung sharply lower on the first day of trading after the Chinese New Year, with the tech-centric Shenzhen Composite opening 2% higher but ending -1.22% lower. With little change on the fundamental horizon, this could be attributed to profit-taking activity as stock markets have accumulated significant unrealized gains year-to-date.
Australia’s ASX 200 index opened 0.5% lower, dragged by energy (-2.26%), materials (-0.79%) and health care (-0.76%) sectors, whereas information technology (+1.24%) and real estate (+0.26%) were doing the heavy lifting.
Crude oil prices fell from a 12-month high as Texas oil wells gradually resumed operating after a cold blast halted more than 1/3 of America’s output. Meanwhile, the US officials said they would agree to meet with Iran for nuclear talks, which increases the chance of higher Iranian oil supply should a nuclear deal be stuck.
On the macro front, today’s US Markit manufacturing PMI data will be closely eyed by traders. Markets foresee a cooling of manufacturing sentiment to 58.5 from 59.2 seen in January, but well above the threshold of 50.0 that separates expansion and contraction. Find out more on the DailyFX calendar.
Sector-wise, 9 out of 11 S&P 500 sectors ended lower on Thursday, with 61.2% of the index’s constituents closing in the red. Energy (-2.27%), communication services (-0.75%) and healthcare (-0.65%) were among the worst performing sectors, while utilities (+0.55%) and consumer discretionary (+0.14%) were up slightly.
S&P 500 Sector Performance 18-02-2021
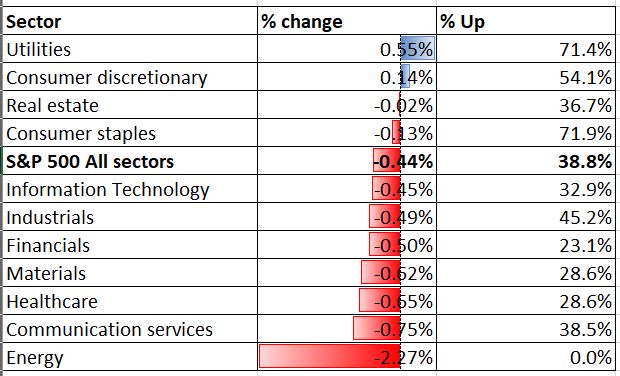
Source: Bloomberg, DailyFX

Recommended by Margaret Yang, CFA
What does it take to trade around data?
S&P 500 Index Technical Analysis:
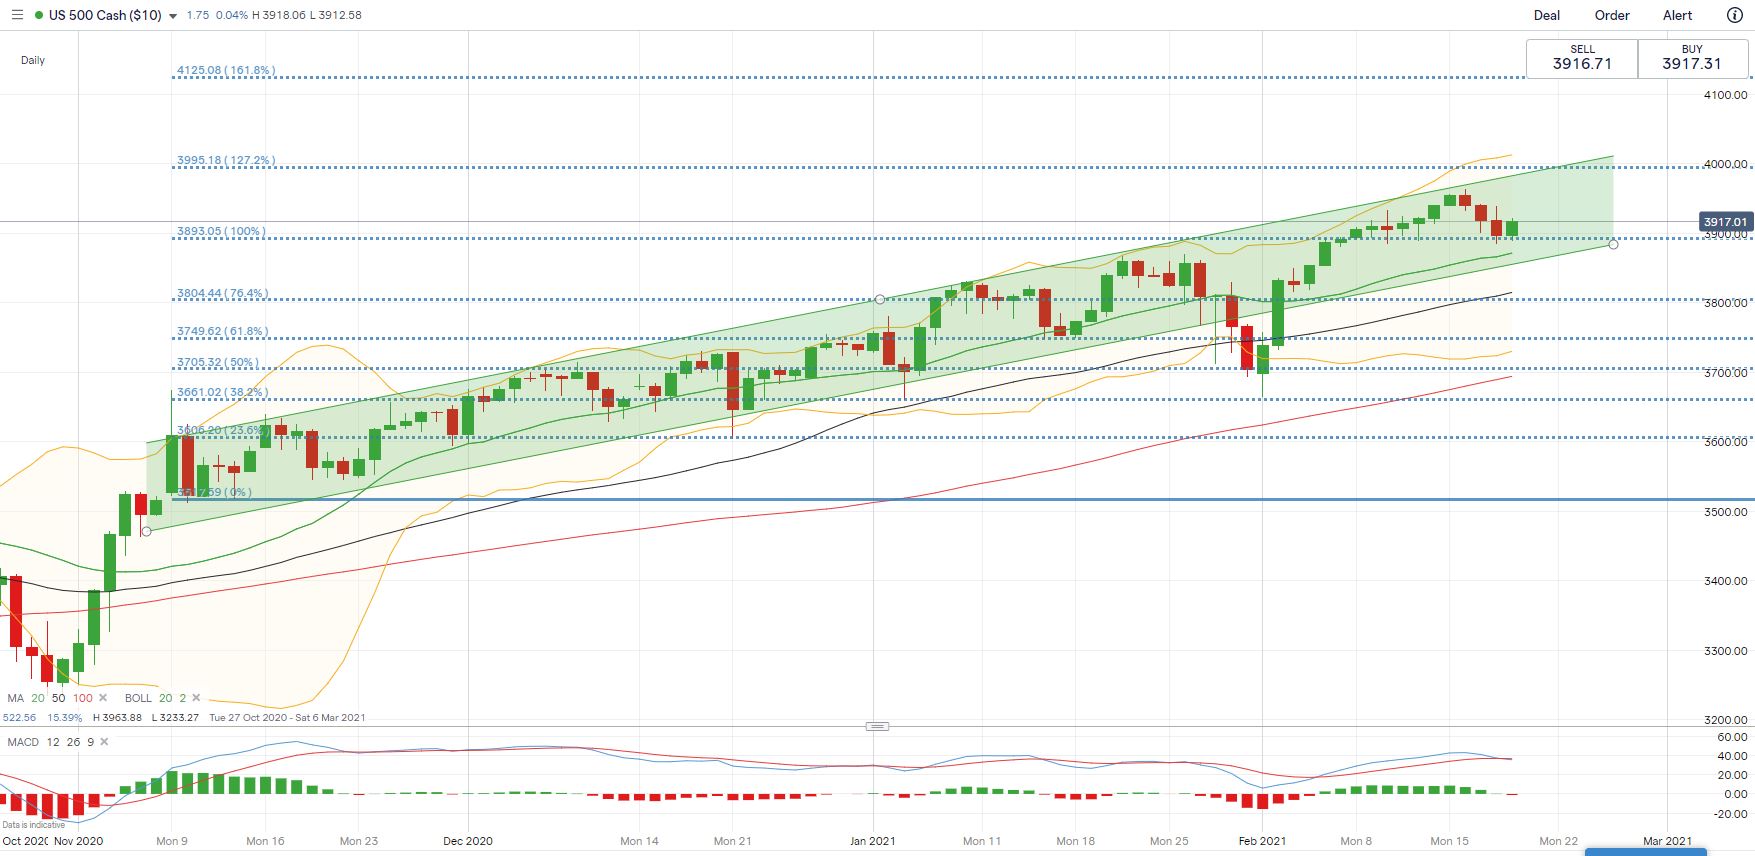
Technically, the S&P 500 index remains in an upward trajectory after returning to the “Ascending Channel” in early February. The overall trend remains bullish-biased, although another mild technical pullback appears to be underway. The MACD indicator has formed a bearish crossover, suggesting that near-term momentum has turned downwards. An immediate support level can be found at 3,893 – the 100% Fibonacci extension level. An immediate resistance level can be found at 3,995 (127.2% Fibonacci extension).
S&P 500 Index – Daily Chart
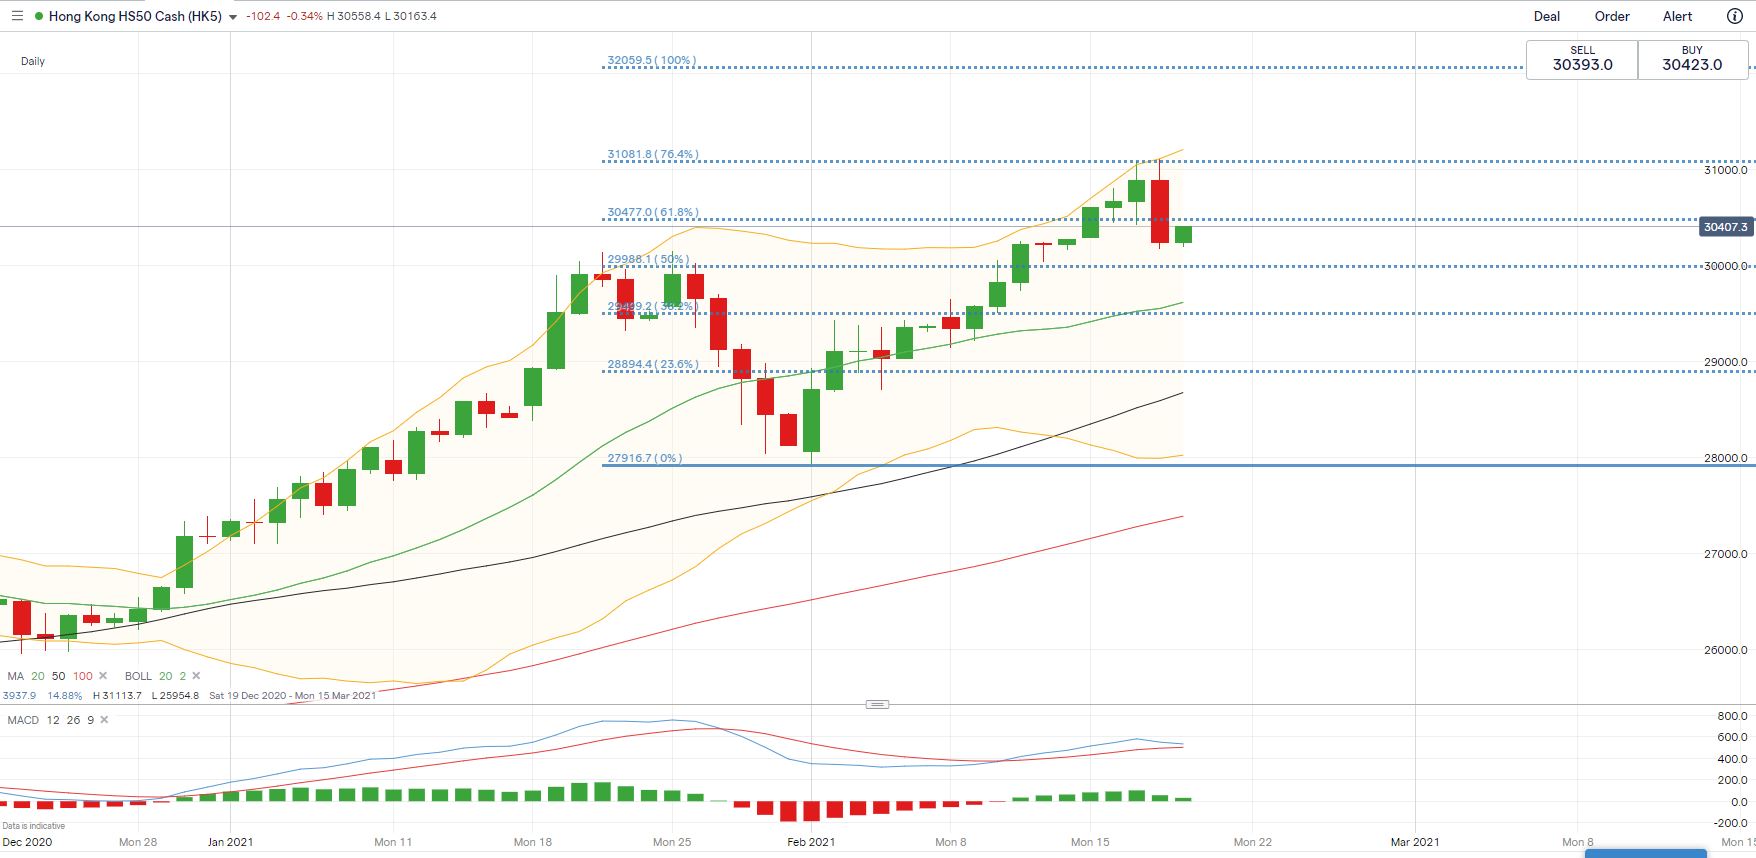
Hang Seng Index Technical Analysis:
The Hang Seng Index hit a strong resistance level at 31,080 (76.4% Fibonacci retracement level) and has since entered a consolidative period. A Bearish Engulfing candlestick pattern points to strong selling pressure near the key resistance, and may hint at further downside potential. An immediate support level could be found at around 29,988 (the 50% Fibonacci extension). Breaking below this level will probably lead to a deeper pullback towards the next support level at 29,500 (the 38.2% Fibonacci extension).
Hang Seng Index – Daily Chart
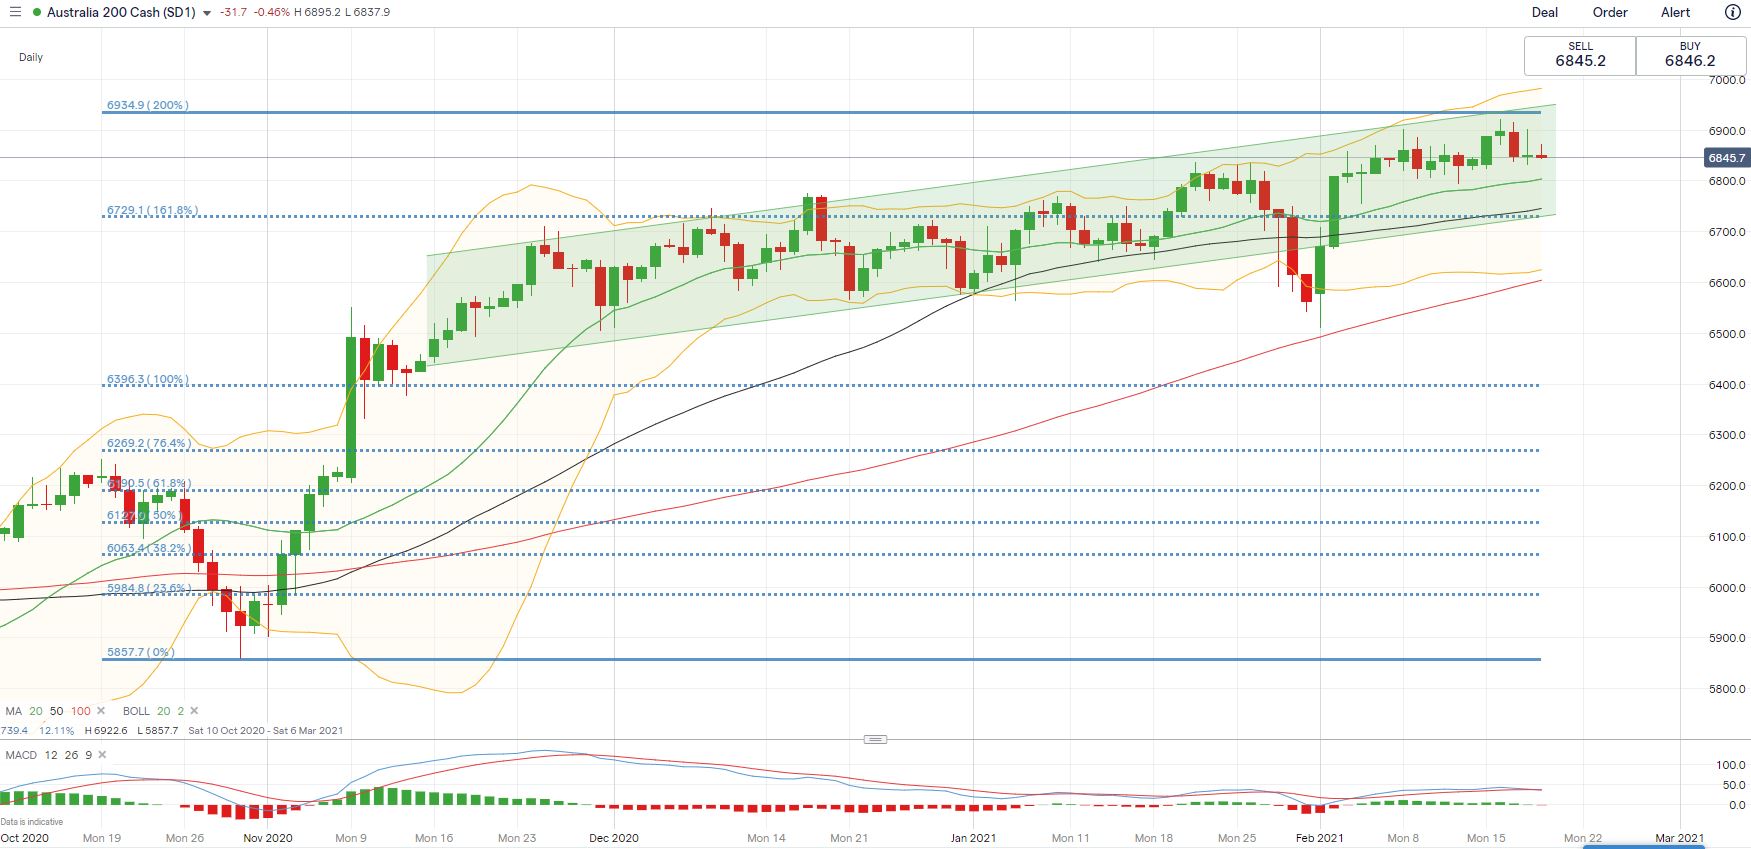
ASX 200 Index Technical Analysis:
The ASX 200 index remains in an “Ascending Channel” and may attempt to break a key resistance level of 6,935 – the 200% Fibonacci extension. Prices are trending higher within the upper Bollinger Band, with the 20-Day Simple Moving Average (SMA) line serving as a dynamic support level. In the near term, prices have likely entered a minor correction, but the overall trend remains bullish-biased.
ASX 200 Index – Daily Chart

Recommended by Margaret Yang, CFA
Building Confidence in Trading
— Written by Margaret Yang, Strategist for DailyFX.com
To contact Margaret, use the Comments section below or @margaretyjy on Twitter
|
|
Leave a Reply
You must be logged in to post a comment.