

Silver (XAG/USD) Analysis:
- Silver experienced recent gains coinciding with a weaker USD but now tests confluent resistance
- Key technical levels for XAGUSD as the metal approaches the 23.6% Fib
- IG Client Sentiment remains significantly net long
Advertisement
Fundamental Drivers for Silver Remain
Silver has posted a sizeable rebound off the September low which corresponds with the period of decline in the US dollar index – a proxy for the strength of the US dollar. A lower dollar price for silver often leads to an increase in the assets price as the lower dollar price makes the metal cheaper to buy from an FX perspective for international buyers.
It warrants mentioning that price trends in silver are closely related to those of gold as they tend to respond to similar drivers of price, generally: demand and supply, (low) real interest rates, inflation expectations, speculation, and safe haven appeal which is linked to the state of the global economy.
In the current low interest rate (low yield) environment, these precious metals can become more attractive. As central banks around the world consider various stimulus packages and, as is the case with the Bank of England (BoE), central banks may even consider adopting negative interest rate policy (NIRP) in an attempt to spark economic growth.
Starts in:
Live now:
Oct 15
( 11:10 GMT )

Stay abreast of the latest central bank developments
Central Bank Weekly
Precious metals offer no yield (only price appreciation) therefore, in a low or zero interest rate environment, market participants start to consider holding precious metals like gold and silver more seriously.
Learn How to Trade Using the Gold-Silver Ratio
Key Technical Levels for Silver
Considering the fundamentals backing higher silver prices for most of 2020 thus far, there do remain a number of challenges to further upside, at least in the near term, which opens the door to a potential move lower. Resistance can be observed in the weekly silver chart where the current weekly bar, highlighted in blue – had approached the 23.6% Fibonacci level (drawn from the March low to the August high) and has held since.
XAG/USD Weekly Chart with Fibonacci levels
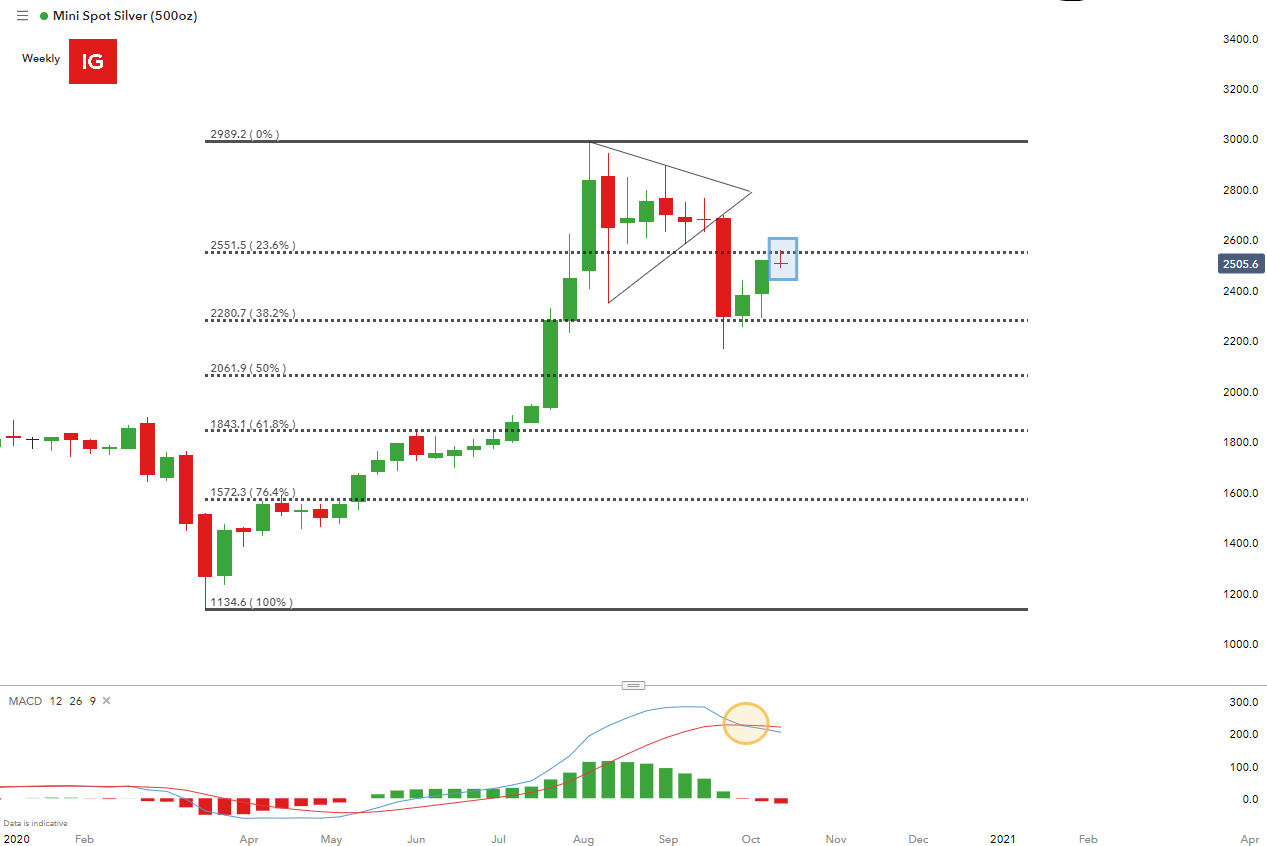
Chart prepared by Richard Snow, IG
Scaling into the daily chart – an analysis technique called multiple time frame analysis – there is a clear area of confluence captured around the blue circle on the price chart. The area of confluence acts as near term resistance and is comprised of the descending trendline, the 23.6% Fib and the upper trendline of the ascending channel.
Starts in:
Live now:
Oct 20
( 17:10 GMT )

Learn how to analyze price action in your trade set ups
Trading Price Action
Silver Daily Chart: Key Technical Levels
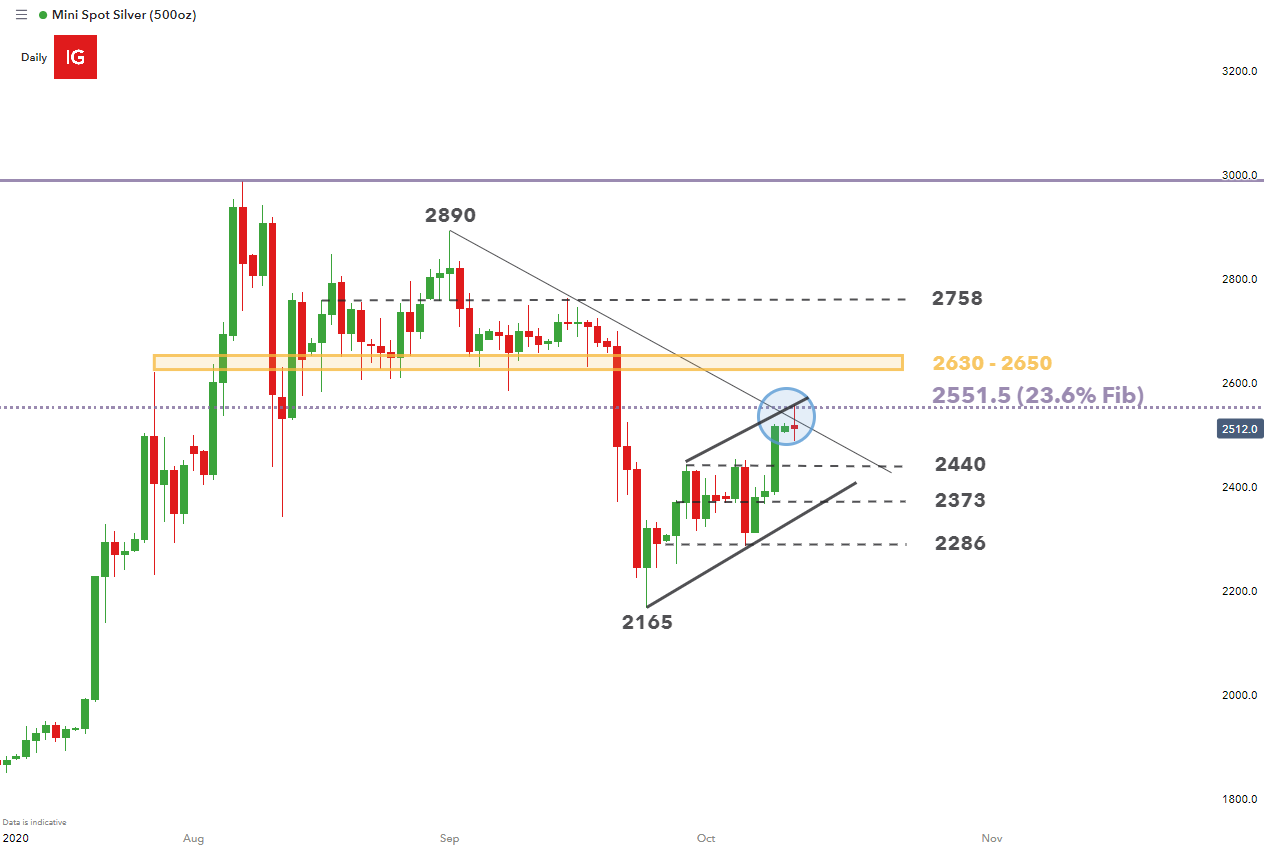
Chart prepared by Richard Snow, IG
As long as price is contained below the area of confluence, this opens up the possibility of a lower move towards the lower bound of the channel. The nearest level of support is 2440 followed by 2373, 2286 and lastly, the low of 2165 although this remains a fair distance away.
In the event price breaks and closes above confluence resistance, the next level of resistance is the 2630 – 2650 zone followed by the 2758 and 2890 levels.
Silver Client Positioning
| Change in | Longs | Shorts | OI |
| Daily | 3% | -2% | 3% |
| Weekly | -2% | 6% | -1% |

- Retail trader data shows 86.38% of traders are net-long with the ratio of traders long to short at 6.34 to 1. Generally, client sentiment is used as a contrarian indicator.
- Silver traders, much like gold traders, tend to maintain a bullish bias towards precious metals for extended periods of time (seen by the virtually horizontal blue line). Therefore, closer attention is warranted when interpreting client positioning as the general contrarian approach may not be particularly useful. Helpful resources include looking at the daily and weekly changes in sentiment as well as non-commercial data published in the CBOE Commitment of Traders (CoT) report – Learn How to Read the CoT Report.
- The number of traders net-long is 2.59% higher than yesterday and 2.71% lower from last week, while the number of traders net-short is 6.14% higher than yesterday and 10.94% higher from last week.
- Yet traders are more net-short than yesterday and compared with last week. Recent changes in sentiment warn that the current Silver price trend may continue higher despite the fact traders remain net-long.
— Written by Richard Snow for DailyFX.com
Contact and follow Richard on Twitter: @RichardSnowFX
|
|
Leave a Reply
You must be logged in to post a comment.