

South African Rand Outlook:
Fears of a second wave weigh heavy on the ZAR
With South Africa recently easing restrictions in an effort to reopen the economy, investors are still wary about the future of the emerging market. While South Africa is still currently experiencing the first wave of the coronavirus pandemic, fears surrounding Europe’s second wave combined with economic instability appear to be weighing heavy on the ZAR.
Visit the DailyFX Educational Center to discover why news events are Key to Forex Fundamental Analysis
From a technical standpoint, the weekly chart below highlights the Fibonacci levels from three major moves. Currently, price action is trading in an area of confluency between the 38.2% level of the short and medium term move. As long as bulls maintain control above the psychological level of 17.00, a bullish breakout cannot be ruled out.
Starts in:
Live now:
Sep 27
( 22:09 GMT )

Join James Stanley’s Price Action Webinar
Key News Trading Events for the Week Ahead
USD/ZAR Weekly Chart
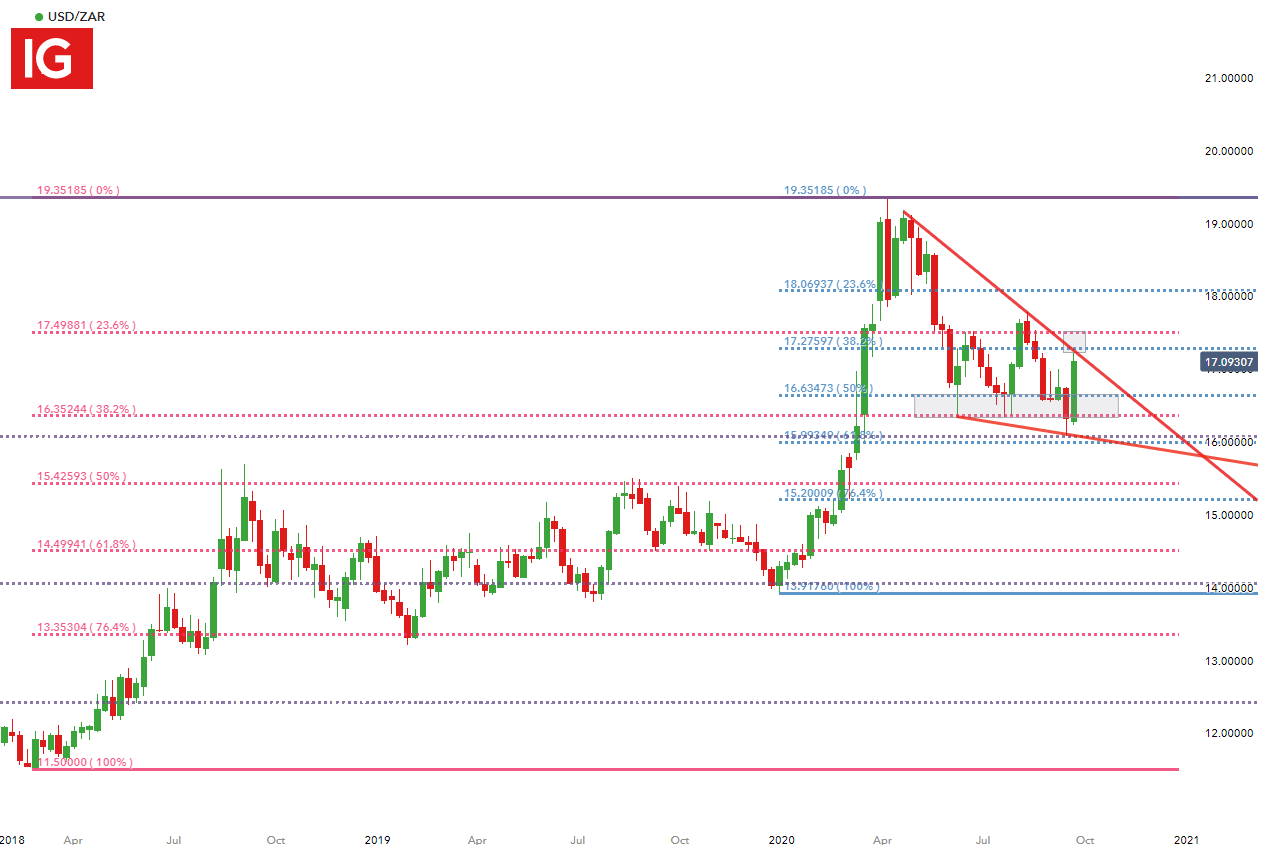
Chart prepared by Tammy Da Costa, IG
MACD Crosses Below the Zero Line
From the short-term perspective, the daily chart below highlights the Moving Average Divergence Convergence (MACD) cossover from below the zero line towards the upside, a potential signal that the pair may be in oversold territory and further upward momentum may be expected.

Recommended by Tammy Da Costa
How can news impact your trades?
However, on the long side, price action in the pair has just run into a trendline projection that can be found by connecting the April 23rd high to the August high; and this began to come into play yesterday. It has since held a second day of resistance as bulls shy away from fresh highs ahead of the weekend.
USD/ZAR Daily Price Chart
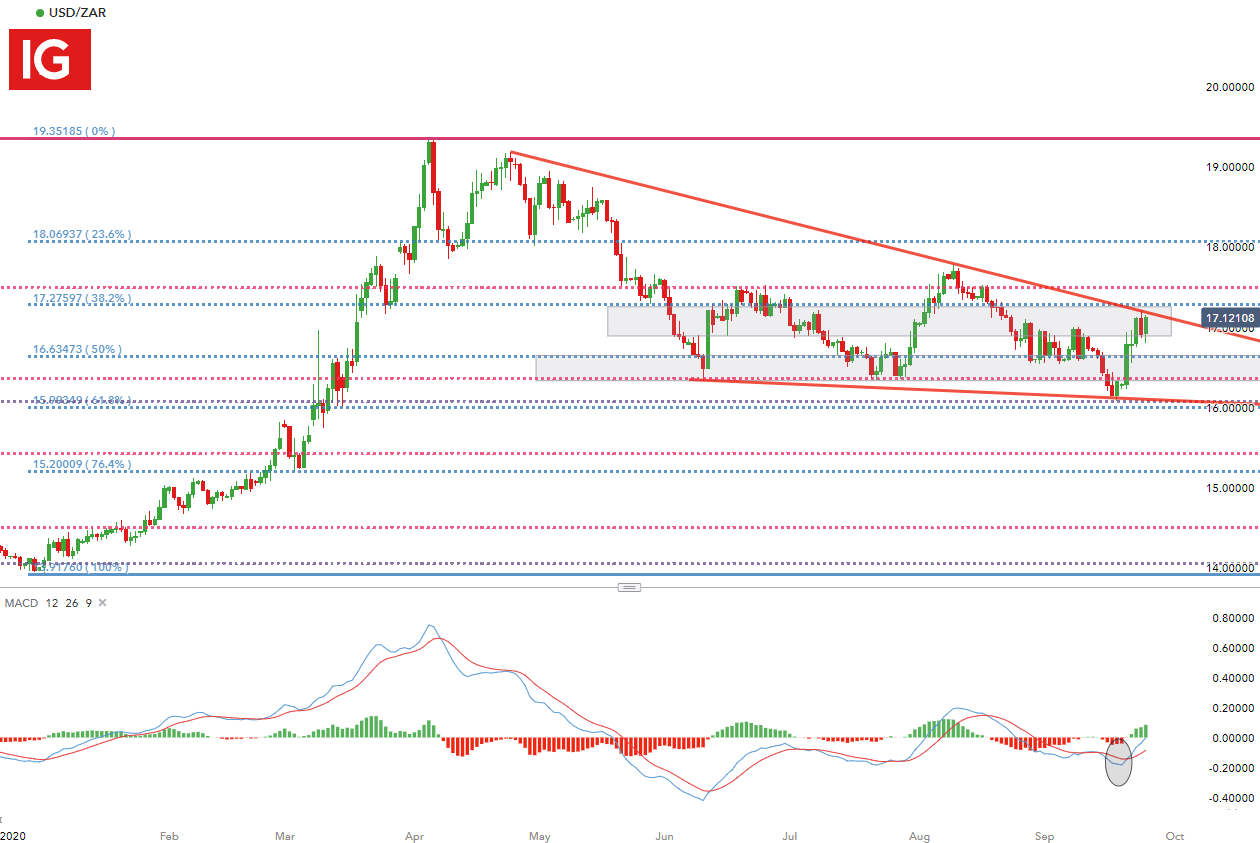
Chart prepared by Tammy Da Costa, IG
USD/ZAR Strategy Ahead
As long as bulls maintain control above 17.00, the 38.2% Fibonacci retracement remains as resistance at 17.275. If this level is broken, further upside may prevail with the next resistance level around the 17.5 figure.
On the other hand, a break below may push price action towards the next level of support at 16.634, the 50% retracement of the short-term move.
— Written by Tammy Da Costa, Market Writer for DailyFX.com
Contact and follow Tammy on Twitter: @Tams707
|
|
Leave a Reply
You must be logged in to post a comment.