

S&P 500, Nasdaq 100, JOLTS Job Openings, July Fed Hike – Asia-Pacific Briefing:
- S&P 500, Nasdaq 100 sink for a second day as sentiment deteriorates
- Global growth woes, signs of a still-tight US labor market were in focus
- A Rising Wedge is taking shape in the S&P 500 as upside momentum fades
Recommended by Daniel Dubrovsky
Get Your Free Equities Forecast
S&P 500
The S&P 500, Nasdaq 100, and Dow Jones fell on Wednesday marking a second day of souring risk appetite. Earlier this week, the fiscal tightening implications of a potential US debt ceiling deal contributed to the deterioration in market sentiment. During the past 24 hours, a couple of notable economic events likely added momentum to the turn lower in stock markets.
During Wednesday’s Asia-Pacific trading session, the latest Chinese Manufacturing PMI print crossed the wires. It was disappointing across the board, alluding to slowing global growth expectations. Meanwhile, April US JOLTS job openings data surprised higher. This translated to about 1.8 job openings per unemployed person in the country.
Financial markets continued to bolster their expectations for a 25-basis point rate hike from the Federal Reserve in July. Meanwhile, a pause in June might be the likely scenario. Over the past 24 hours, Federal Reserve Governor Philip Jefferson said that “skipping a hike would allow time to assess data”. Of course, economic conditions remain fluid. On Friday, we will get the next non-farm payrolls report.
With that in mind, Thursday’s Asia-Pacific trading session could follow in the footsteps of Wall Street. That would place regional indices, such as Japan’s Nikkei 225 and Australia’s ASX 200 at risk. This would open the door for sentiment as the key driver for markets given a fairly quiet economic docket.
S&P 500 Technical Analysis
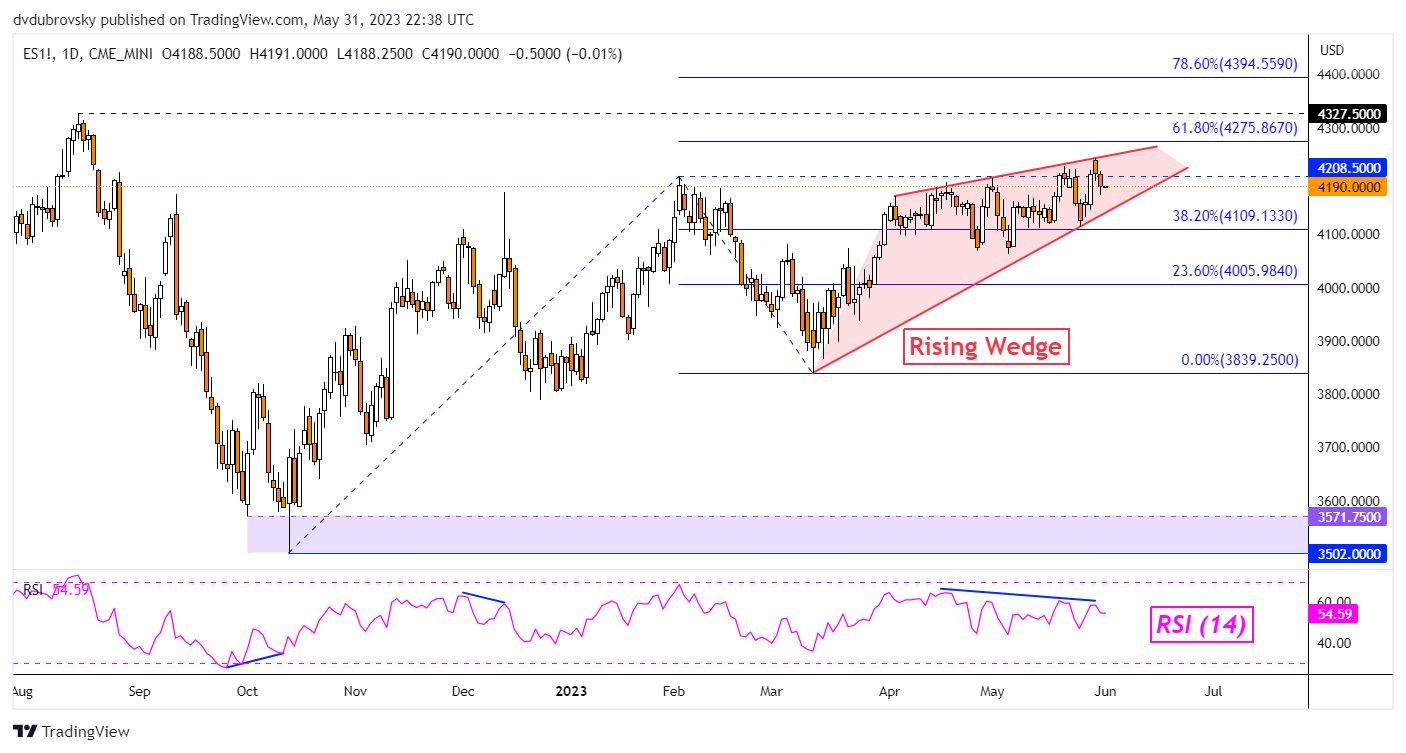
On the daily chart, the S&P 500 appears to be trading within the boundaries of a Rising Wedge chart formation. Meanwhile, negative RSI divergence shows that upside momentum is fading. That can at times precede a turn lower. Breaking under the wedge would open the door to a turn lower, placing the focus on support. That seems to be the 38.2% Fibonacci extension level at 4109.
Trade Smarter – Sign up for the DailyFX Newsletter
Receive timely and compelling market commentary from the DailyFX team
Subscribe to Newsletter
S&P 500 Daily Chart
— Written by Daniel Dubrovsky, Senior Strategist for DailyFX.com
|
|
Leave a Reply
You must be logged in to post a comment.