

EQUITY MARKET OUTLOOK:
- The S&P 500 and Nasdaq 100 advance after Tuesday’s selloff, but gains are modest as Powell’s hawkish message limits risk appetite
- Lack of directional conviction suggests many traders remain on the sidelines ahead of key U.S. economic data that may help clarify the Fed’s tightening roadmap
- All eyes are now on the U.S. nonfarm payrolls report due out on Friday morning
Recommended by Diego Colman
Get Your Free Equities Forecast
Most Read: Precious Metals Lose Shine After Powell; What’s Next for Gold and Silver?
U.S. stocks wavered and lacked directional conviction on Wednesday as traders continued to digest Federal Reserve Chair Jerome Powell’s hawkish comments during his semiannual testimony before Congress. When it was all said and done, the S&P 500 and Nasdaq 100 finished the day modestly higher after the previous session’s sell-off, with the former advancing 0.14% to 3,992 and the latter climbing 0.52% to 12,215.
The main takeaway from Powell’s two-day hearing in Washington was that the FOMC’s peak rate is likely to rise more than initially anticipated and that the institution is prepared to accelerate the pace of tightening if the totality of information were to require stronger measures.
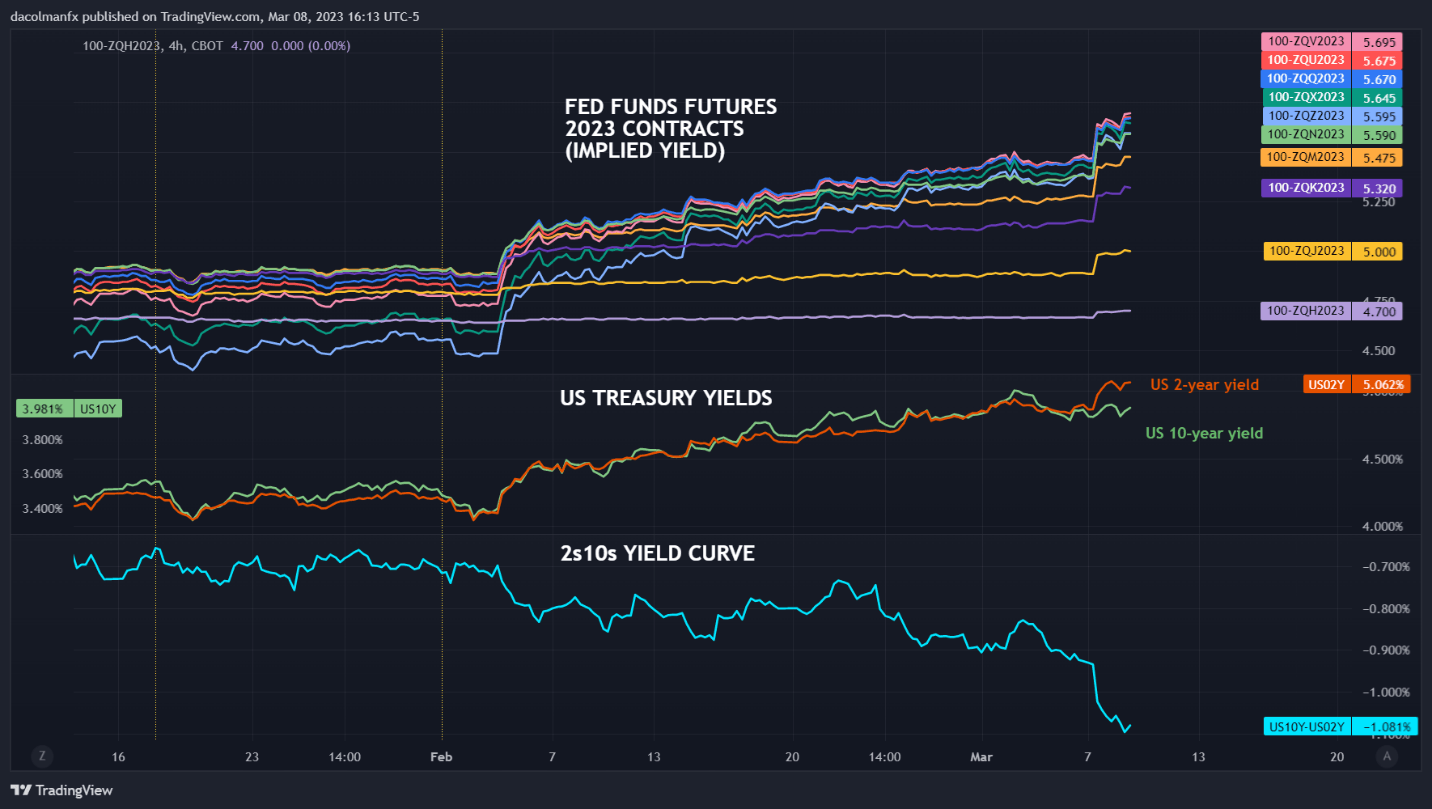
Markets were quick to react to Powell’s aggressive message, repricing higher the hiking path and solidifying bets for a 50 bp interest rate rise at the March FOMC meeting. These expectations could consolidate if the economy retains momentum, so it is important to closely watch incoming data to better assess future policy actions.
One major economic report that traders should carefully examine this week is the February U.S. employment survey. Consensus estimates predict the U.S. economy added 205,000 jobs last month, but robust payroll gains in the private sector suggest hiring remained remarkably solid.
Tight labor markets are likely to keep wage growth biased to the upside and sustain steady household spending over the medium term, reinforcing price pressures in the economy at a time when CPI is running more than three times faster than the 2.0% long-term target.
Recommended by Diego Colman
Traits of Successful Traders
EQUITY MARKET OUTLOOK
Upside inflation risks may prompt the Fed to revert to more forceful tactics, increasing the likelihood that the terminal rate will have to settle in the vicinity of 6.0% and stay there for an extended period of time – a bearish outcome for the equity space.
With bonds offering increasingly attractive yields that top 5.0% at short-dated maturities, it is difficult to see investors steadily deploying capital into riskier assets such as stocks, especially as the corporate earnings outlook remains weak and the extreme inversion of the yield curve screams recession. For those reasons, both the S&P 500 and the Nasdaq 100 will have difficulty mounting a durable recovery.
FED FUNDS FUTURES IMPLIED YIELD, TREASURY YIELDS & 2s10s CURVE
Source: TradingView
| Change in | Longs | Shorts | OI |
| Daily | 6% | -10% | -2% |
| Weekly | 7% | -17% | -5% |
S&P 500 TECHNICAL ANALYSIS
The S&P 500 defended the 200-day simple moving average after February’s pullback, but hasn’t been able to rebound meaningfully from those levels; in fact, prices are still stuck below the ascending trendline that guided the recovery off the October 2022 lows, a sign of little of bullish conviction.
With many traders on the sidelines, while waiting for the next NFP report, the index could remain somewhat directionless over the next 24 hours, but volatility is likely to pick up heading into the weekend.
Having said that, on a move lower, initial support appears at 3,940, followed by 3,890. On further weakness, the focus shifts to the December 2022 lows near 3,765. In contrast, on a move higher, the first resistance to consider comes in at 4,025 and 4,100 thereafter. After that, the next area of interest is located slightly below the psychological 4,200 mark.
S&P 500 TECHNICAL CHART
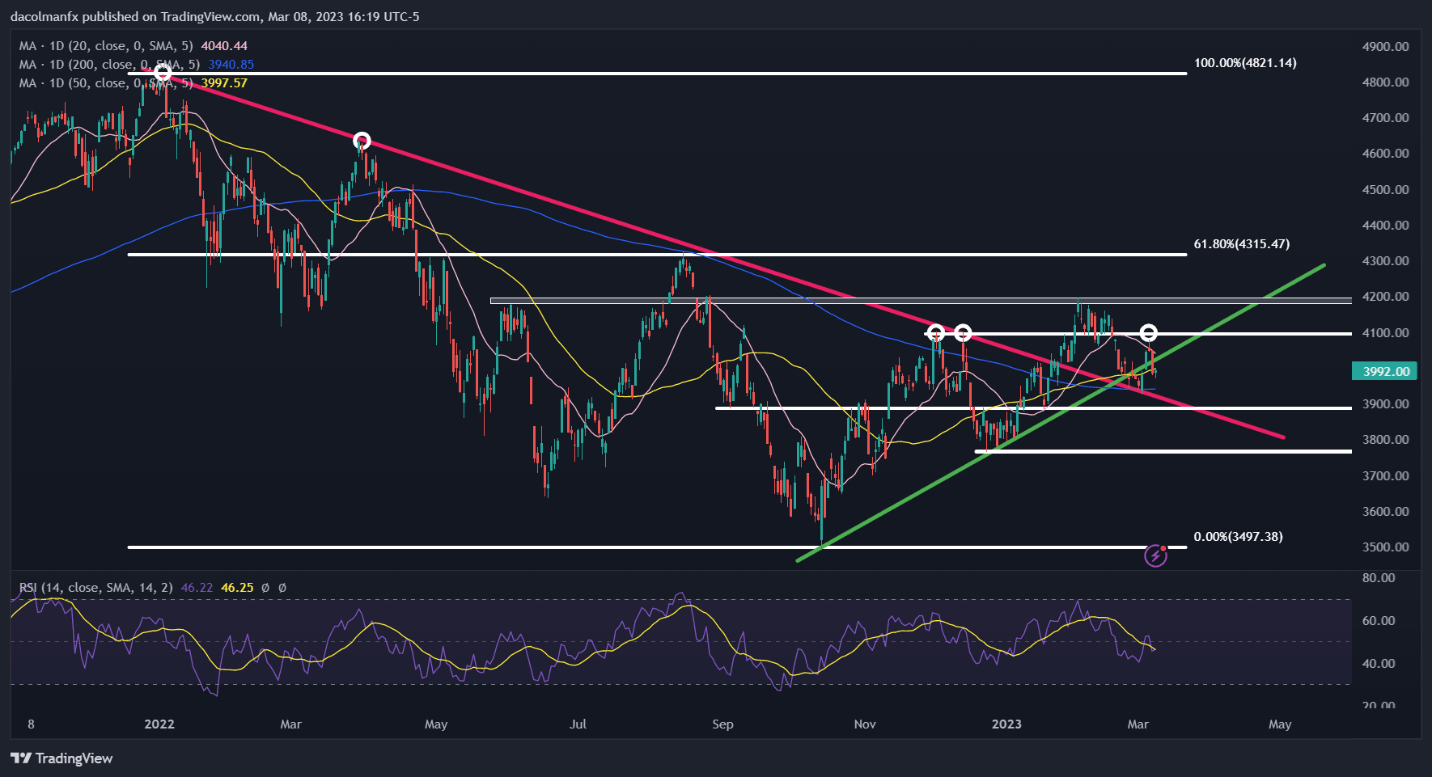
S&P 500 Chart Creating in TradingView
|
|
Leave a Reply
You must be logged in to post a comment.