

S&P 500 Post CPI Outlook: 4000 Technical Support and Resistance Firms Ahead of Earnings
- SPX 500 retests 4021 but bears retaliate driving prices back below 4000.
- US equity futures mixed after US CPI prints in-line with expectations. Inflation pressures ease but robust labor market could give the Fed more ammunition to hold rates higher for longer.
- S&P 500 futures muted below technical resistance at 200-day MA (moving average)
- Earnings and Michigan Sentiment on tap.
Recommended by Tammy Da Costa
Get Your Free Equities Forecast
S&P 500 Rises Above 4000 Before Falling Lower
US CPI fell in-line with expectations with both Core and headline inflation declining in the month of December. With investors and the Fed monitoring these figures closely, easing price pressures lifted S&P 500 futures driving prices back above 4,000 before moving lower.
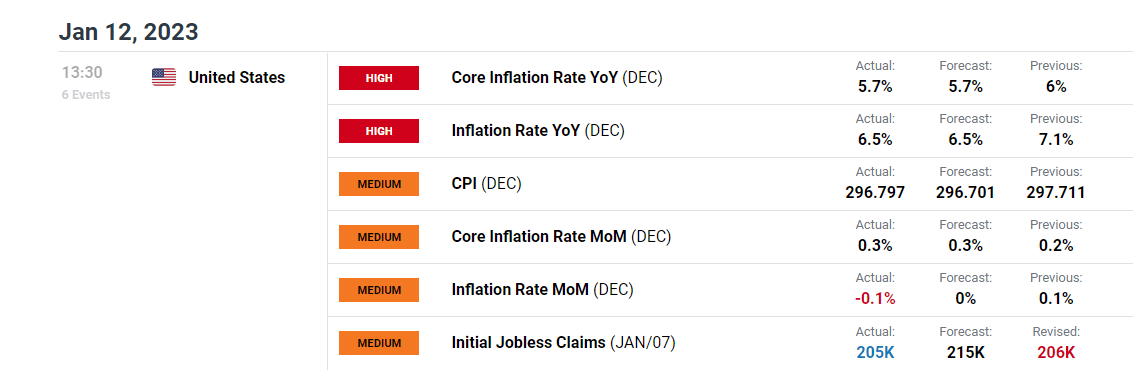
For all market-moving data releases and economic events see the real-timeDailyFX Calendar.
S&P 500 (SPX) 30 Minute Chart
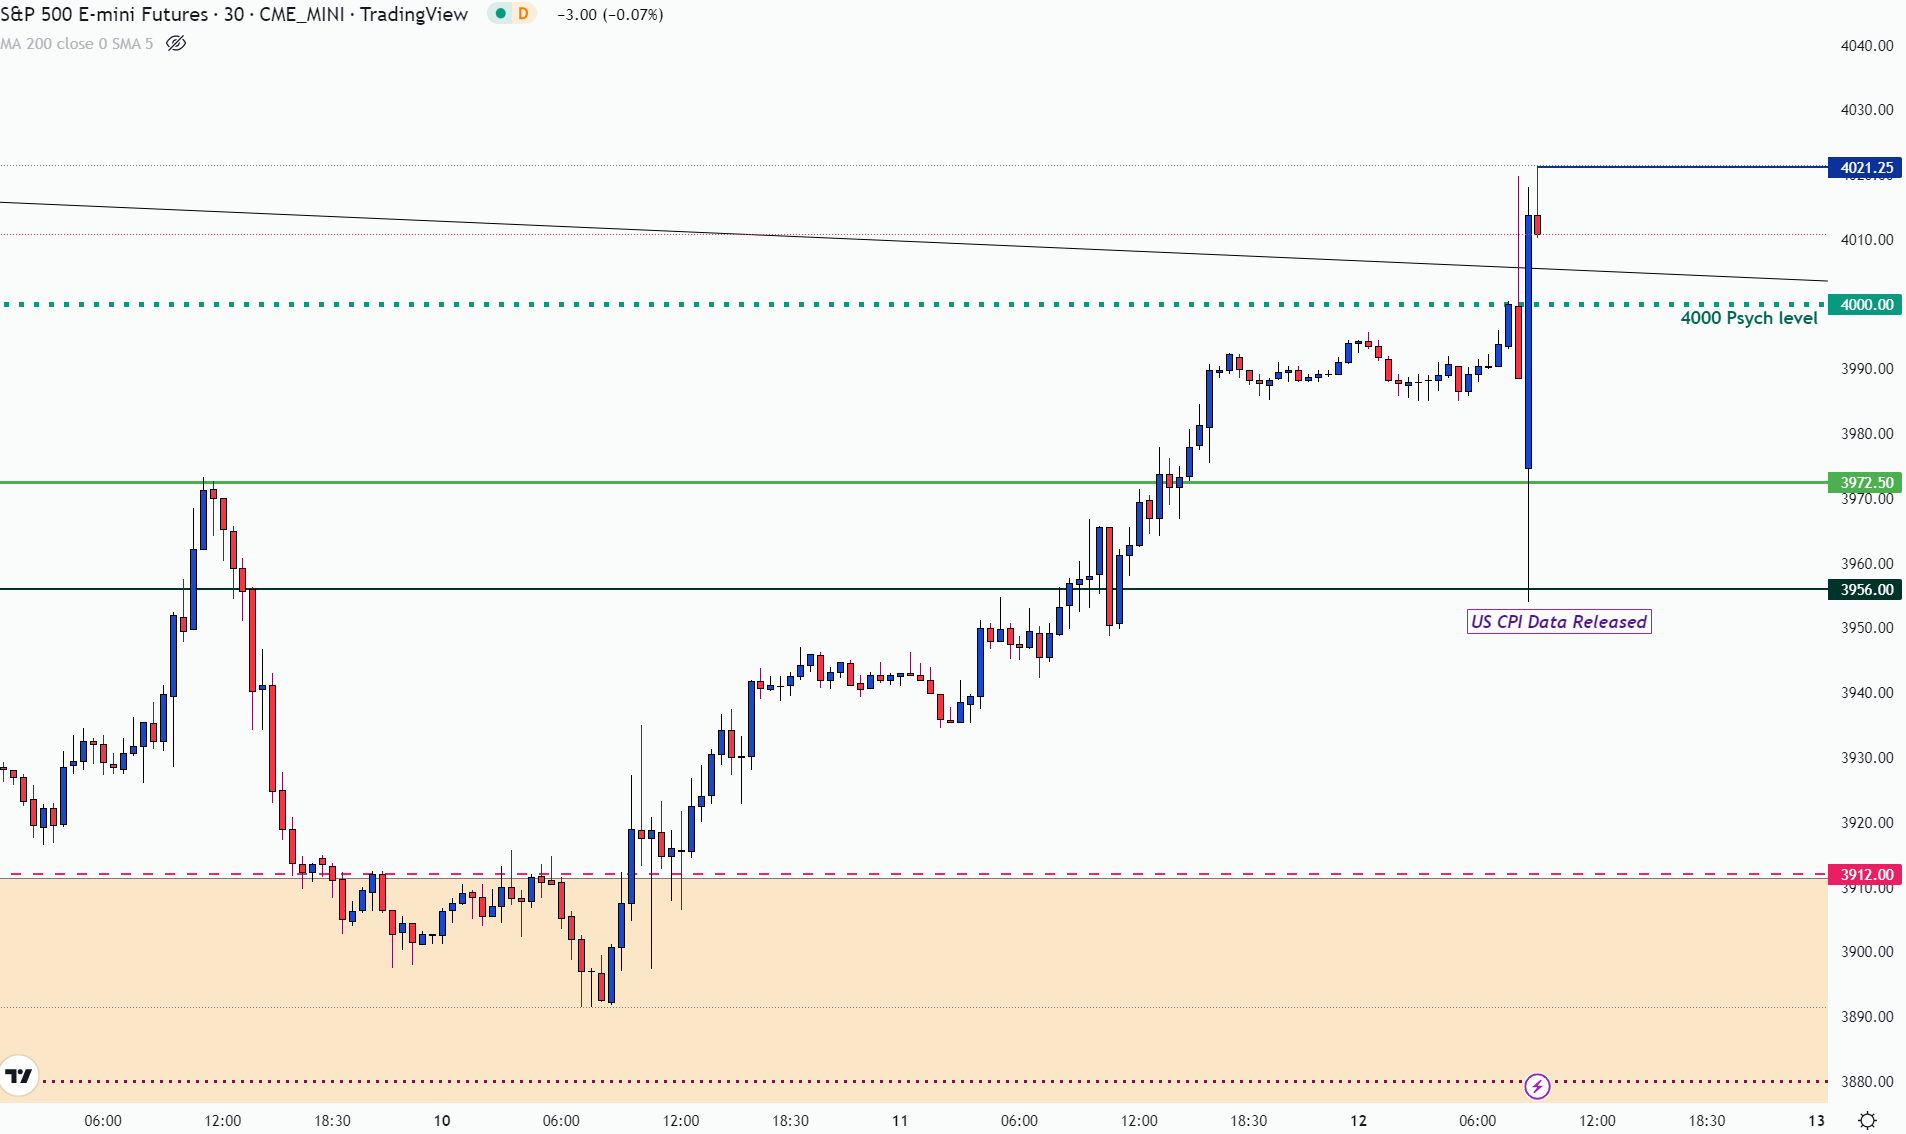
Chart prepared by Tammy Da Costa using TradingView
S&P 500 Technical Analysis
After trading in a narrow zone of confluency below 3900, the release of a mixed NFP report and weak ISM data triggered the initial move. The restoration of bullish momentum resulted in a weekly close above prior resistance turned support between 3928 – 3912.
Even though the data highlighted a slowdown in the US services and manufacturing sector, lower rate expectations overshadowed recession fears. This helped bolster demand for equities futures, driving the S&P higher.
Recommended by Tammy Da Costa
Futures for Beginners
With the recovery following through to this week, SPX 500 continued toward the next big level of resistance at the key psychological level of 4000.
S&P 500 Daily Chart
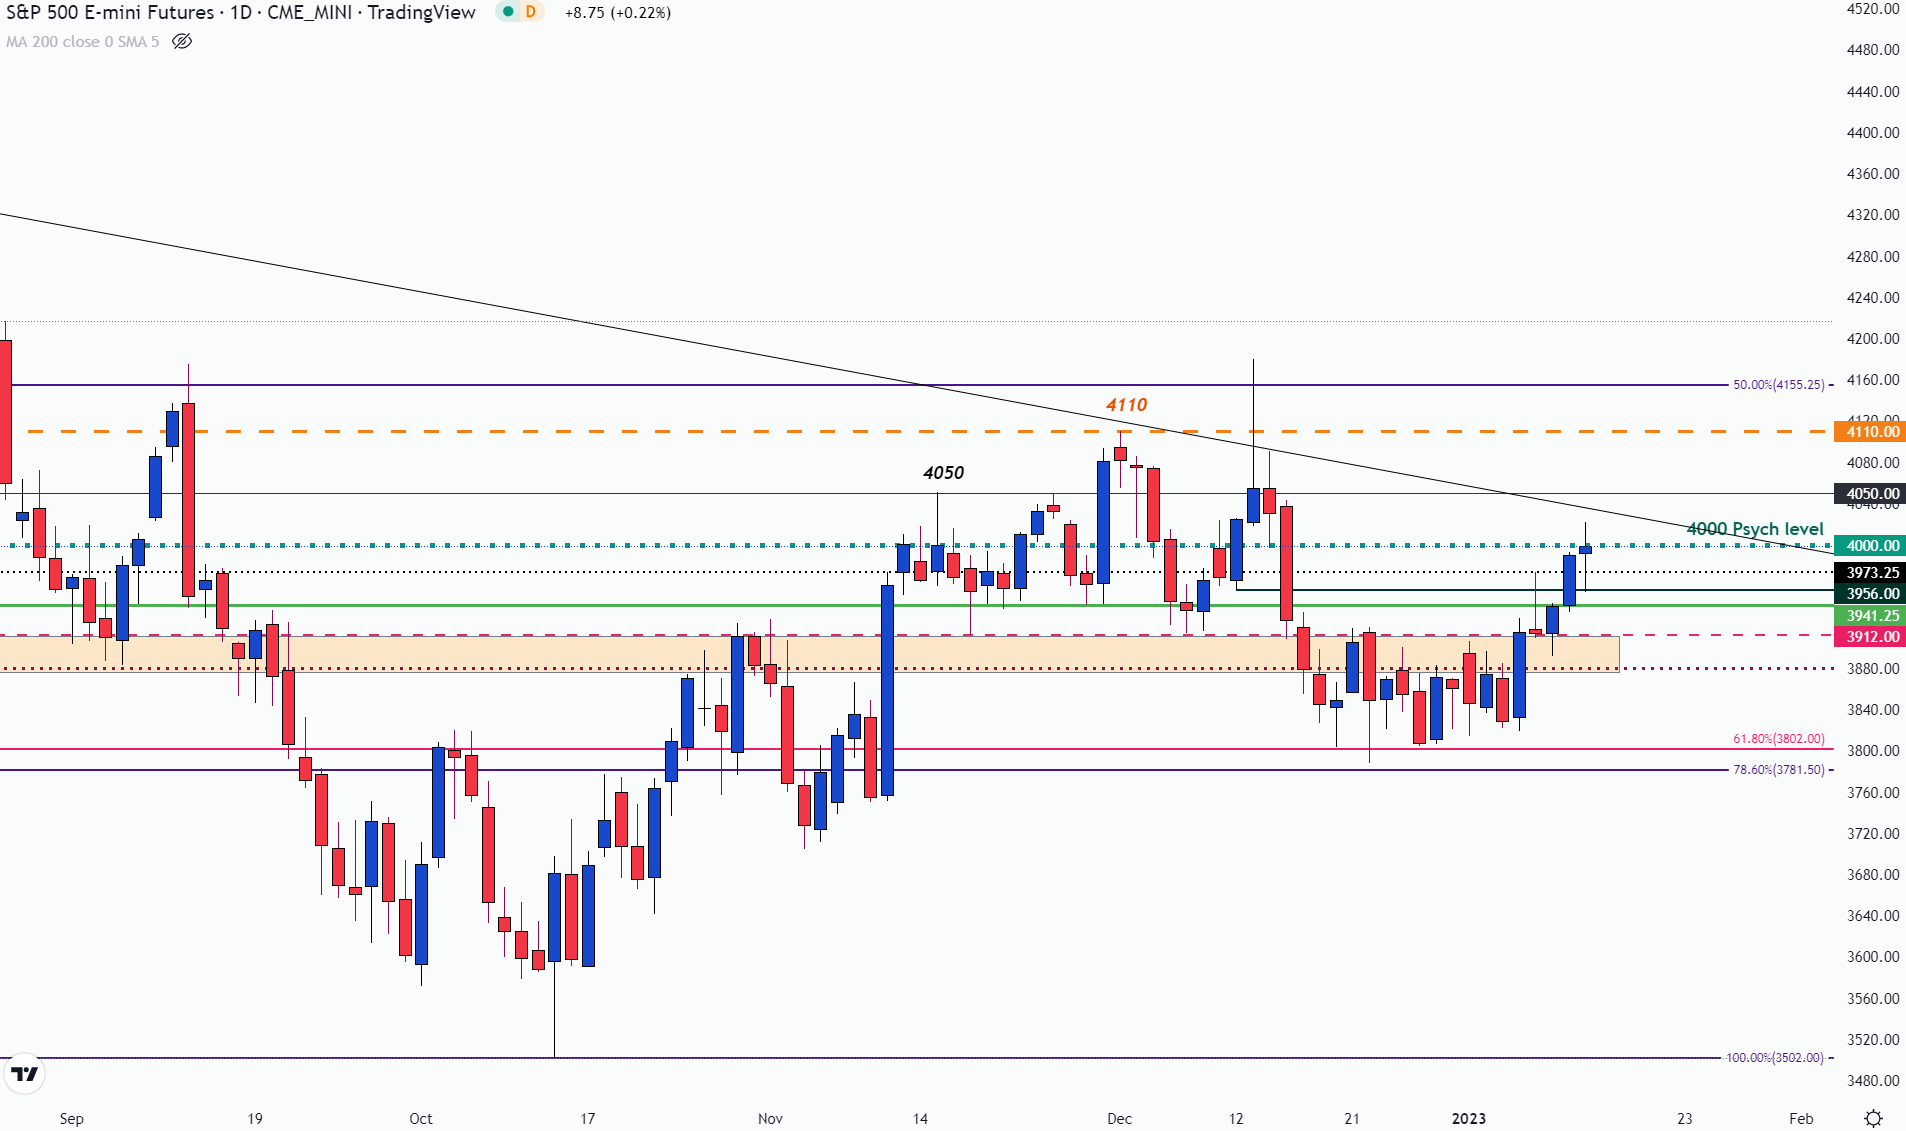
Chart prepared by Tammy Da Costa using TradingView
As the major stock index continues to threaten this zone, a temporary retest of 4020 was met with swift retaliation by bears. From the four-hour chart below, the long wick above the recent candle has illustrated rising efforts from sellers to limit the upside move.
After a series of low-bodied formed slightly above 3985, a deeper correction a hold below long-term trendline resistance has placed additional pressure on the bullish trend.
S&P 500 Four – Hour Chart
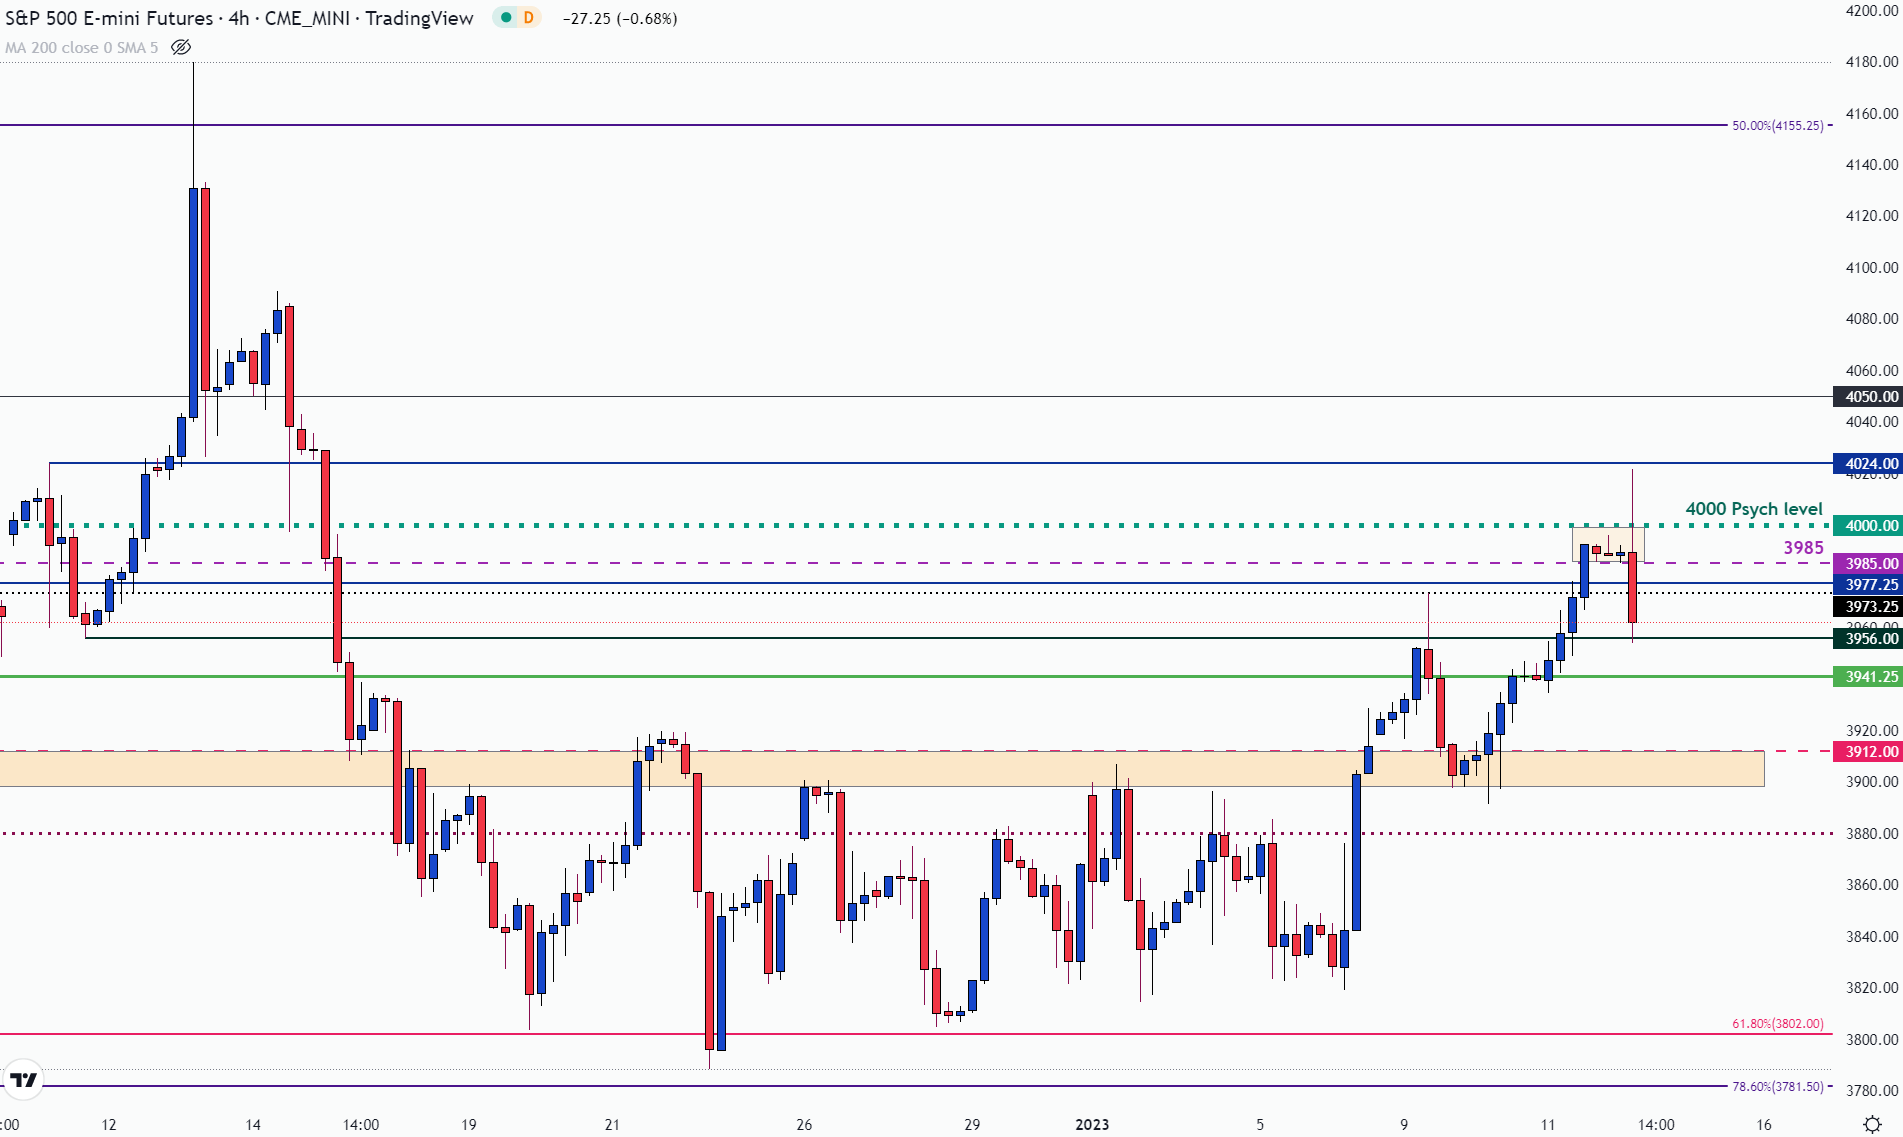
Chart prepared by Tammy Da Costa using TradingView
Now that investors have had an opportunity to digest the renewed expectations, tomorrow’s Michigan sentiment report and bank earnings could further assist in driving the short-term move.
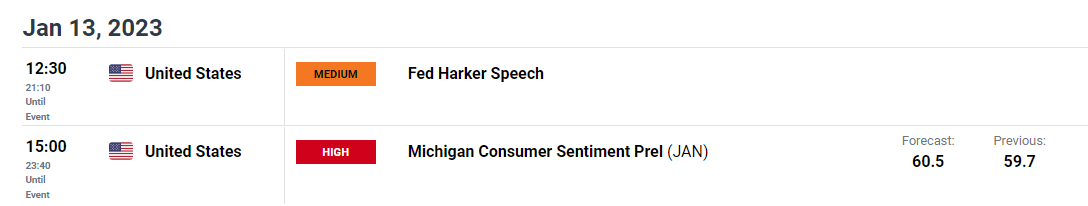
DailyFX Economic Calendar
While prices continue to honor the 200-day MA (moving average) at 3990, a drop below 3956 could open the door for bearish continuation towards the same support at prior resistance zone between 3928 – 3912.
Trade Smarter – Sign up for the DailyFX Newsletter
Receive timely and compelling market commentary from the DailyFX team
Subscribe to Newsletter
— Written by Tammy Da Costa, Analyst for DailyFX.com
Contact and follow Tammy on Twitter: @Tams707
|
|
Leave a Reply
You must be logged in to post a comment.