

Chart created with TradingView
Sterling (GBP) Charts and Analysis:
- Chances of a no-deal outcome are increasing.
- BoE commentary leaves further monetary stimulus on the table.
Starts in:
Live now:
Sep 07
( 10:09 GMT )

Recommended by Nick Cawley
Key UK Events and Markets for the Week Ahead
The British Pound is becoming increasingly vulnerable to a hard Brexit outcome with little to no visible progress on future EU/UK trade made between the two sides. After the latest informal talks between the two sides, EU chief negotiator Michel Barnier accused the UK of lacking any real willingness to move forward, leaving the EU deadline of October 31 in doubt. The UK for its part refuses to countenance any deal on fisheries and level playing field commitments saying that it is not compatible with the UK’s status as an independent country. The odds of a hard/no-deal Brexit have risen to between 30% and 50% according to various market sources reports and commentary and this leaves Sterling vulnerable over the next 7 weeks. The next round of talks start on September 7th.

Recommended by Nick Cawley
Building Confidence in Trading
In a recent speech titled ‘The economy and COVID-19: looking Back and Looking Forward’, Bank of England external member of the MPC Michael Saunders noted that unemployment is ‘likely to rise significantly in coming quarters’ and that if the economic recovery stalls, ‘some further monetary loosening may be needed’. While the BoE have consistently said that all monetary policy options are live, including negative rates, further QE is likely with the MPC meeting and monetary policy report publication on November 5 the most likely date. The UK gilt market continues to suggest lower for longer interest rates with the gilt curve negative-yielding all the way out to 6-years.
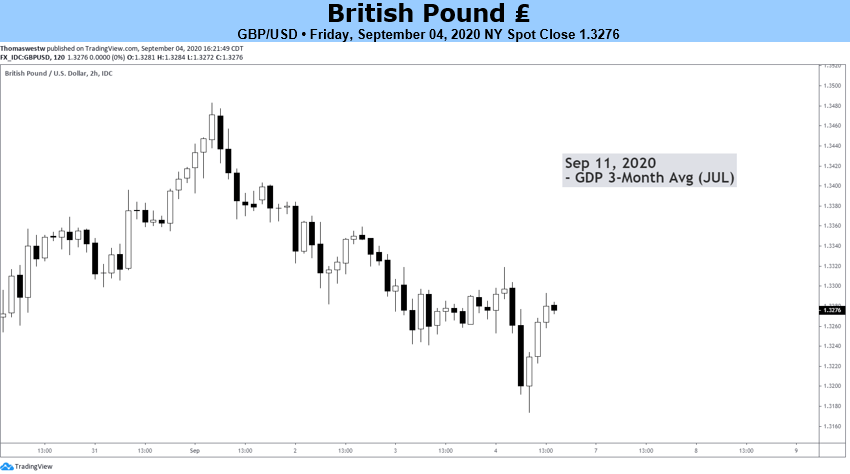
Next week there is little in the way of UK economic data until Friday 11th when the monthly GDP-3 month average for July is released at 07:00 GMT. This is expected to show a sharp pick-up in UK growth to -7.5% from a prior -20.5% with the year-on-year number falling to -11.2% from -16.8%. Manufacturing and industrial production data for July will also be released.
For all economic data and events, see the DailyFX Calendar.
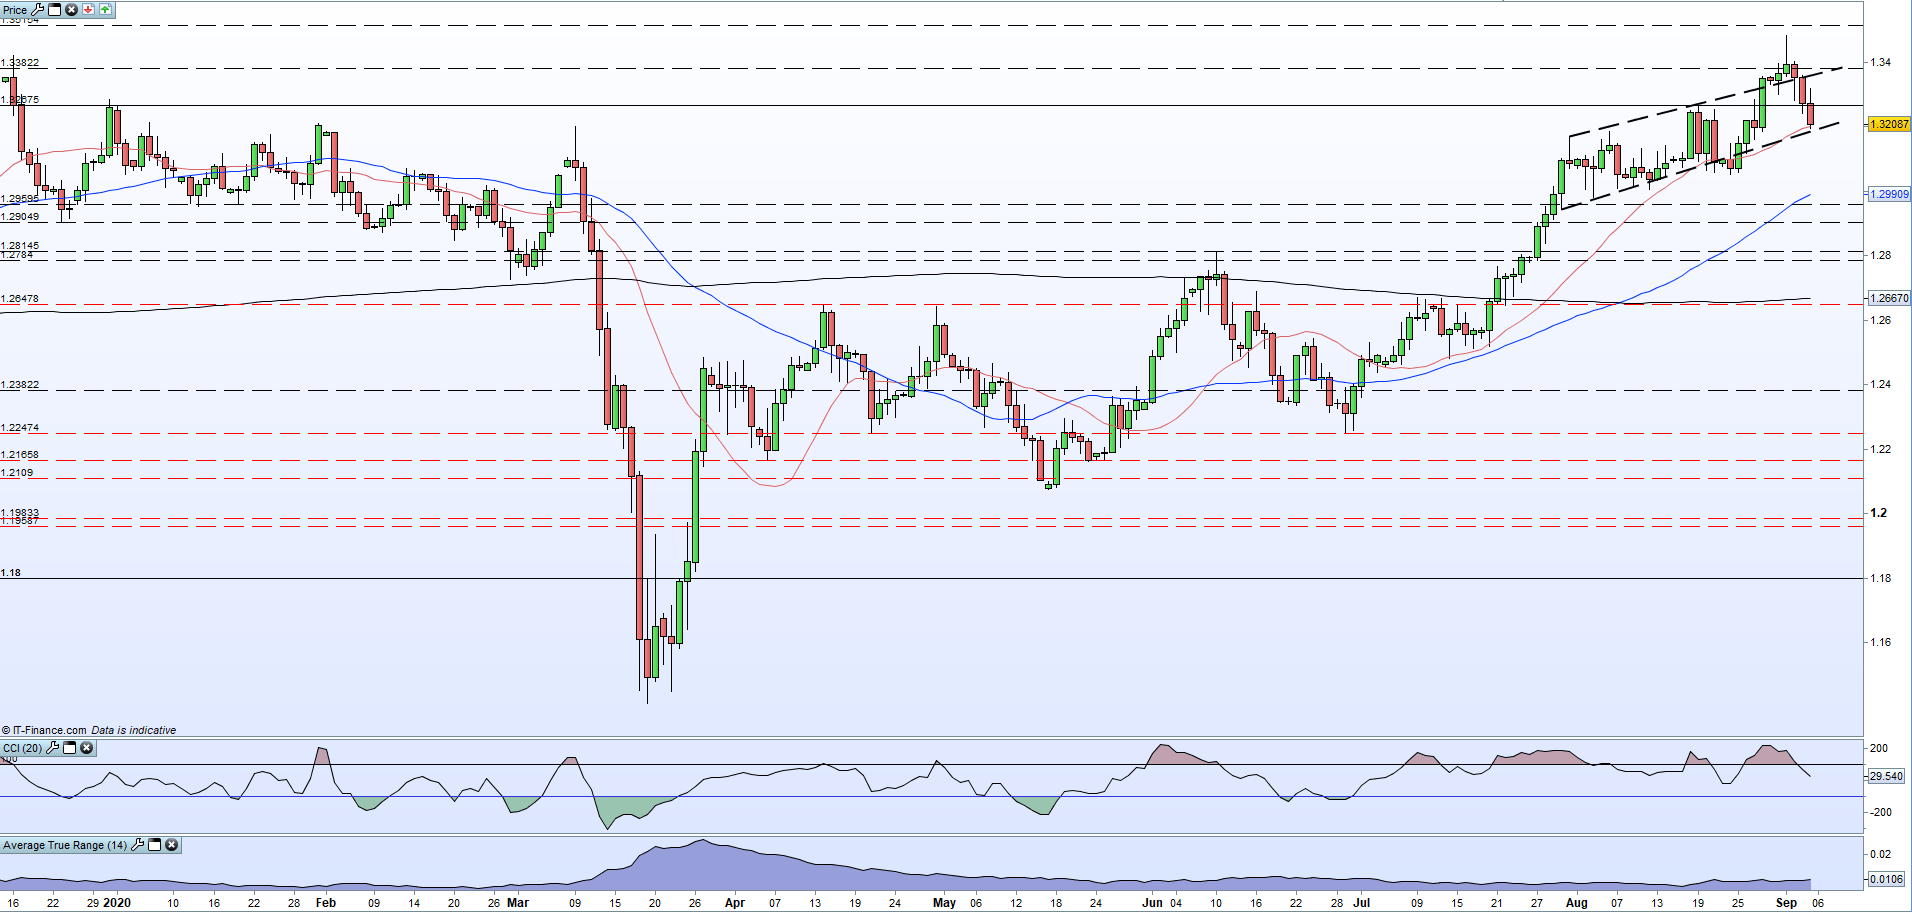
GBP/USD touched a multi-month high of 1.3477 at the start of the week before fading lower to a current level of 1.3200, due in part to a resurgent US dollar. The chart shows that cable has been moving higher in a bullish flag formation, but this is now under threat a cluster of old lows around 1.3050 the next area of support.
GBP/USD Daily Price Chart (January – September 4, 2020)
| Change in | Longs | Shorts | OI |
| Daily | -18% | -12% | -14% |
| Weekly | 16% | -20% | -10% |
IG client sentiment data shows retail traders are net-short GBP/USD, normally a bullish contrarian signal for the pair. However, traders are less net-short than yesterday and compared with last week. Recent changes in sentiment warn that the current GBP/USD price trend may soon reverse lower despite the fact traders remain net-short.
Traders of all levels and abilities will find something to help them make more informed decisions in the new and improved DailyFX Trading Education Centre
What is your view on Sterling – bullish or bearish?? You can let us know via the form at the end of this piece or you can contact the author via Twitter @nickcawley1.
|
|
Leave a Reply
You must be logged in to post a comment.