

US Dollar Forecast Overview:
- The US Dollar (via the DXY Index) has fallen below uptrend support in place since 2011, offering another piece of evidence that the greenback is in the early stages of a longer-term decline.
- Fresh highs in EUR/USD rates and more weakness in USD/JPY rates, amid another turn lower by US Treasury yields (both nominal and real), is proving treacherous for the greenback.
- Retail trader positioningsuggeststhat USD/JPY traders are on mixed footing as the pair retraces all of its gains in August.

Recommended by Christopher Vecchio, CFA
Get Your Free USD Forecast
US Dollar Bears Down
The first half of August proved uneventful for the US Dollar (via the DXY Index), but the second half of the month is proving treacherous once more. The DXY Index remains embroiled in a downtrend relative to its coronavirus pandemic high set in March, while finding further traction to the downside amid a break of longstanding technical support dating back to 2011.
The weak technical backdrop is proving fertile ground for another deterioration in USD fundamentals, with US Treasury yields turning lower; and more importantly, real US yields are pointing to the downside again. An environment defined by negative real yields remains difficult for the US Dollar – as it would for any currency dealing with such fundamental moorings.
DXY PRICE INDEX TECHNICAL ANALYSIS: DAILY CHART (August 2019 to August 2020) (CHART 1)
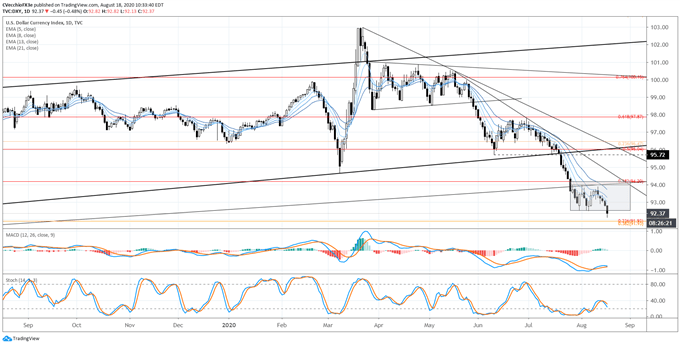
The DXY Index’s performance in the first half of August proved to stunt bearish momentum, but this was not a sign that the downtrend was finished. As noted in the US Dollar forecast last week, “The sideways range carved out, between the 2011/2018 trendline support and the 38.2% Fibonacci retracement (of the 2017 high/2018 low range) as resistance and the August low as support, yields a range of 92.85 to 94.20. Contextually, this could be a bear flag: the favored resolution would appear to be to the downside.” Now that fresh yearly lows have been achieved, the measured move calls for a drop down to 91.50.
DXY PRICE INDEX TECHNICAL ANALYSIS: WEEKLY CHART (August 2011 to August 2020) (CHART 2)
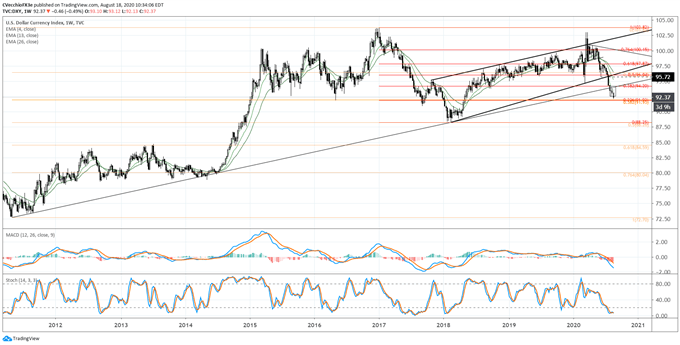
We’ve previously stated that “having already traded below the rising channel support as well as the 38.2% retracement of the 2017 high/2018 low range at 94.20, the DXY Index faces a longer-term bearish breakdown.” With the US Dollar bear flag breakdown beginning on the daily timeframe, focus shifts to the weekly chart.
Technical momentum remains bearish and is now accelerating, with the DXY Index trading below the weekly 4-, 13-, and 26-EMA envelope (still is in bearish sequential order). Weekly MACD is trending lower in bearish territory, while Slow Stochastics are nestled in oversold territory.
The longer-term channel breakdown that would suggest more significant losses over the coming months – perhaps towards 88.00 – remains the base case scenario. Invalidation would occur above 94.20.
USD/JPY RATE TECHNICAL ANALYSIS: DAILY CHART (August 2019 to August 2020) (CHART 3)
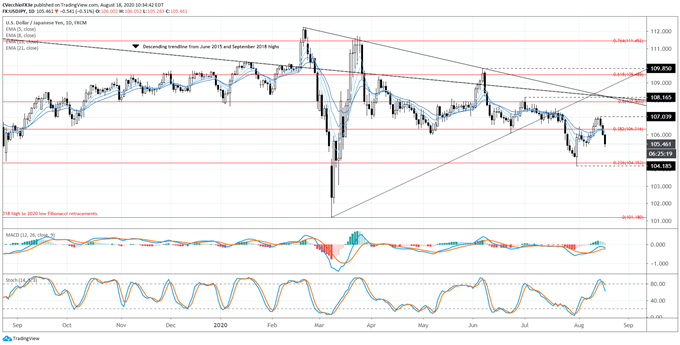
USD/JPY rates have found significant follow through lower after carving out a bearish evening star candle cluster over the final three trading days of last week. As noted in the Japanese Yen weekly technical forecast, “traders shouldn’t rule out more weakness, if only to retrace recent gains.” To this end, USD/JPY rates have retraced all of August’s gains thus far. Slow Stochastics have pulled away from overbought territory, and daily MACD has turned lower below its signal line, confirming the ‘lower high’ established by USD/JPY rates in August (relative to what was seen in June or July).
While it still holds that “the second half of August typically caters to relatively calmer trading conditions that portend to range trading over breakouts,” more USD/JPY weakness towards the July low near 104.19 can’t be ruled out.
IG Client Sentiment Index: USD/JPY RATE Forecast (August 18, 2020) (Chart 4)
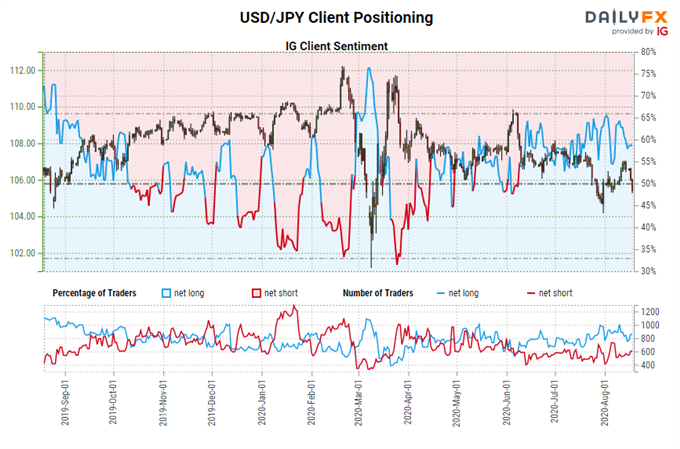
USD/JPY: Retail trader data shows 57.88% of traders are net-long with the ratio of traders long to short at 1.37 to 1. The number of traders net-long is 12.55% lower than yesterday and 7.66% lower from last week, while the number of traders net-short is 12.43% higher than yesterday and 25.10% lower from last week.
We typically take a contrarian view to crowd sentiment, and the fact traders are net-long suggests USD/JPY prices may continue to fall.
Positioning is less net-long than yesterday but more net-long from last week. The combination of current sentiment and recent changes gives us a further mixed USD/JPY trading bias.

Recommended by Christopher Vecchio, CFA
Traits of Successful Traders
Read more: Central Bank Watch: BOE, ECB & Fed Rate Expectations; EUR/USD, GBP/USD, USD/JPY Positioning Update
— Written by Christopher Vecchio, CFA, Senior Currency Strategist
|
|
Leave a Reply
You must be logged in to post a comment.