

US Dollar, DXY, Debt Ceiling Deal Bets, Jobless Claims – Briefing:
- US Dollar on course for best 2-week gain since September
- Debt ceiling deal bets, jobless claims data boosted demand
- DXY uptrend in focus after 100-day SMA was taken out
Recommended by Daniel Dubrovsky
Get Your Free USD Forecast
US Dollar Back in the Spotlight as Treasury Yields Rise
The US Dollar roared higher on Thursday, extending a recent winning streak. Over the past 2 weeks, the DXY Dollar Index is up about 2.2%. That is the best 10-day performance since September 2022. Let us take a closer look at the past 24 hours and what to expect into the end of the week.
Unsurprisingly, the 2-year Treasury yield has rallied over 8.5% over the past 2 weeks, marking the best performance over such a period since September 2022 as well. Rising near-term bond yields can be seen as a sign of rising confidence in the US economy.
During Thursday’s Wall Street session, reports crossed the wires that Congressmen on Capitol Hill are creating plans to vote in the short term on a bipartisan deal to raise the debt ceiling, opening the door to averting a default.
Meanwhile, timely data on the labor market showed signs of improvement. Initial jobless claims unexpectedly fell to 242k last week. Economists were eyeing a 251k increase. Still, both numbers are below the previous +264k print.
As a result, financial markets continued pricing out near-term rate cuts from the Federal Reserve amidst a still-tight labor market and sticky underlying inflation. Since last Wednesday, almost 2 rate cuts were taken off the outlook in one-years’ time.
This is likely why the US Dollar rallied. Heading into the remaining 24 hours, all eyes turn to a speech from Chair Jerome Powell and former Chair Bernanke during a policy panel. If the former continues cooling near-term Fed rate cut bets, USD could add momentum to its impressive rally.
US Dollar Technical Analysis
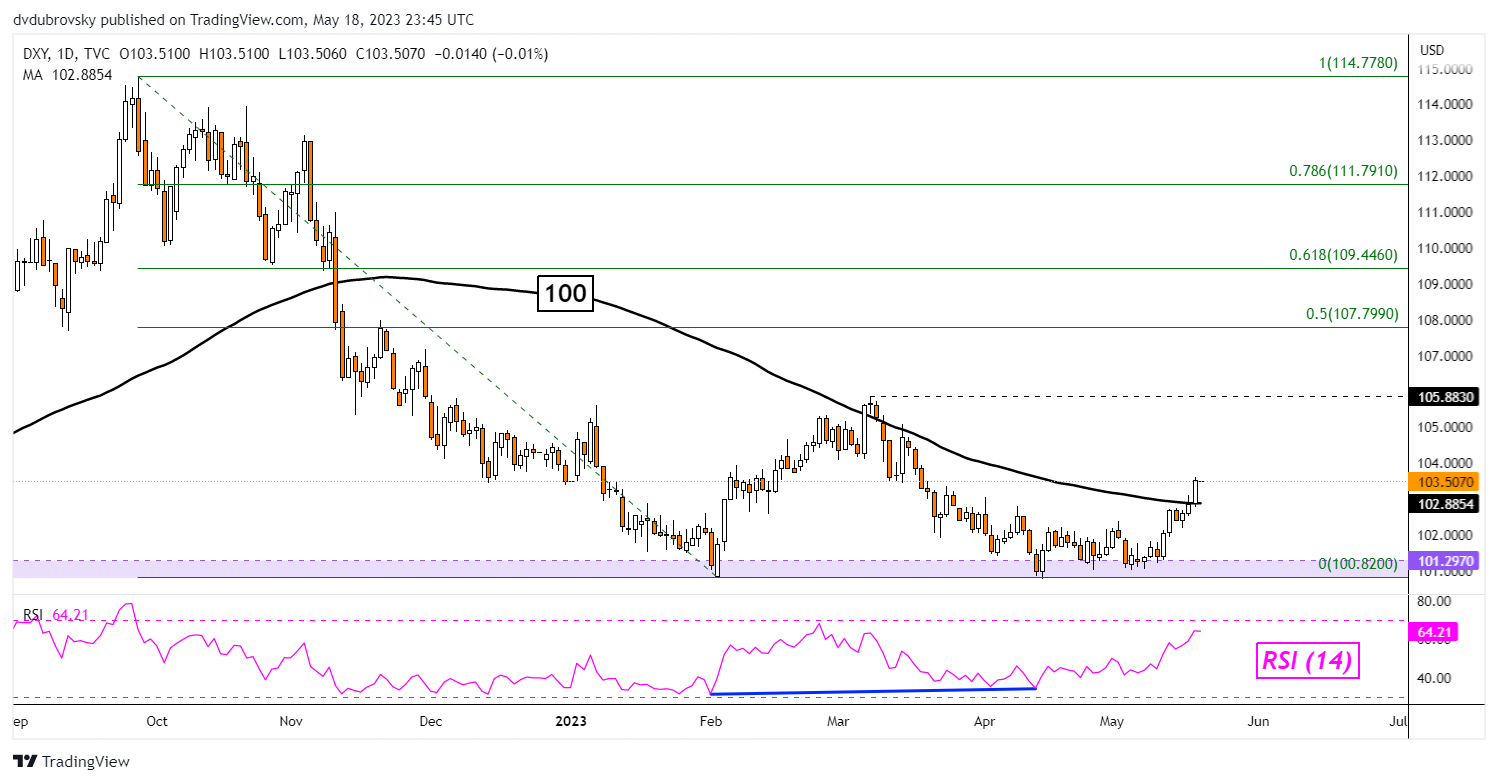
On the daily chart, DXY has broken above the 100-day Simple Moving Average (SMA). That has exposed the March high of 105.88. Given upside confirmation, this could open the door to extending higher in the near term. Key support is the 100.82 – 101.79 range below.
Trade Smarter – Sign up for the DailyFX Newsletter
Receive timely and compelling market commentary from the DailyFX team
Subscribe to Newsletter
DXY Daily Chart
— Written by Daniel Dubrovsky, Senior Strategist for DailyFX.com
|
|
Leave a Reply
You must be logged in to post a comment.