

US Dollar Forecast Overview:
- The US Dollar (via the DXY Index) is looking into the abyss, threatening to lose uptrend support from the February 2018 low.
- A thin forex economic calendar over the coming days gives little by way of data that could change current narratives around the US Dollar.
- Retail trader positioning suggests that the largest component of the DXY Index, the Euro, will trade sideways in the near-term.

Recommended by Christopher Vecchio, CFA
Get Your Free USD Forecast
US Dollar’s Terrible July
The US Dollar (via the DXY Index) has had a painful July thus far. Through the first thirteen closed trading days of the month, there have only been three days that have produced gains; today is on pace to mark 11 out of 14 trading days in the red for the greenback.
The dour narrative enveloping the US Dollar has not changed: mounting evidence that the US economy will lag its developed counterparts in economic recover leaves the US Dollar vulnerable position, particularly relative currencies whose economies now flattened their curves; the Euro and New Zealand Dollar come to mind. In a week where the forex economic calendar is scant – nothing worth discussing, really – there’s little reason to think that the terrible July will turn better.
US Treasury Yield Curve Not Helping the US Dollar
With each passing day, hopes for a V-shaped economic recovery have dissipated. In the past week, comments made by Federal Reserve officials, both implicitly and explicitly, suggest that the Fed could be implementing yield curve control. Currently, the Bank of Japan and Reserve Bank of Australia are pursuing yield curve control policies.
In effect, the promise to keep rates at these levels through 2022 has sparked and sustained the normalization in the US Treasury yield curve at the very front-end, and the continued depressionis a direct result the extraordinary policy steps taken by the Federal Reserve. The US Treasury yield curve is indeed pitched higher, which under conventional wisdom would suggest that market participants are predicting elevated rates of growth and inflation in the future – but only meagerly.
US Treasury Yield Curve: 1-month to 30-years (July 20, 2020) (Chart 1)
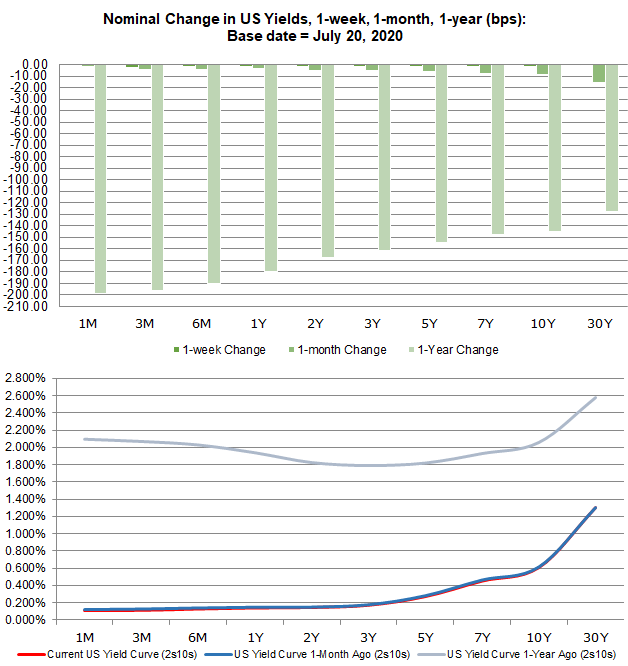
No longer so twisted, the yield curve has experiencing bear steepening in recent weeks, with rates across the curve higher than they were one-, two-, and four-weeks out. Yet yields are, as noted, depressed. The US Treasury 3-year note yield is hovering near 0.200%, whereas one-year ago it was closer to 1.800%. Growth expectations have materially shifted lower, and the bond market is not giving a concerted effort to suggest that they’ll be robust any time soon.
A Dovish Fed is Here to Stay
Nothing has changed with respect to the Federal Reserve, having enacted emergency interest rate cut measures.Rate markets are more or less stuck in a state of suspended animation. If the Fed is going to do anything from here on out, it’s going to come via more QE, a repo facility, etc. The latest extraordinary effort, the Municipal Liquidity Facility, is an example of this effort.
Federal Reserve Interest Rate Expectations (July 20, 2020) (Table 1)
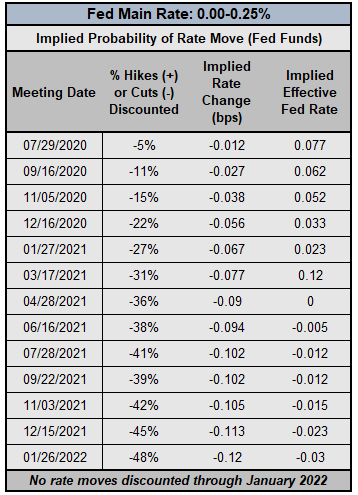
There’s been no indication that the Fed plans on moving rates into negative territory, and as a result, we’ve reached the lower bound for the time being. If yield curve control is implemented, we would expect a similar outcome to what is being experienced by the Reserve Bank of Australia main rate expectations curve in context of the RBA’s promise to keep rates at 0.25% for the next three years (e.g. yield curve control): any suggestions by rates markets that a rate hike is coming anytime soon is a pricing quirk to be ignored; interest rates are not going anywhere higher, at least through January 2022.
DXY PRICE INDEX TECHNICAL ANALYSIS: WEEKLY CHART (November 2016 to July 2020) (CHART 2)
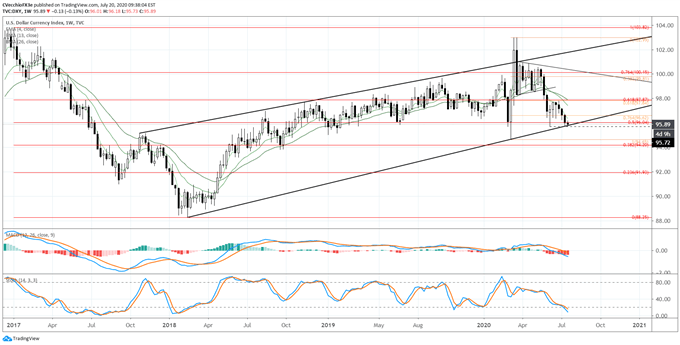
The rising channel from the February 2018 low and the March 2020 low is in focus. Having previously broken the 50% retracement of the 2017 high/2018 low range at 96.04 in June, the DXY Index finds itself trading back at this level once more – this time, however, it is concurrent with channel support. Technical momentum remains bearish, with the DXY Index trading below the weekly 4-, 13-, and 26-EMA envelope, which is in bearish sequential order.
Weekly MACD is trending lower in bearish territory, while Slow Stochastics have reached oversold territory. It still holds that traders should be on alert for a potential channel breakdown that would suggest more significant losses over the coming months – perhaps towards 88.00.
DXY PRICE INDEX TECHNICAL ANALYSIS: DAILY CHART (July 2019 to July 2020) (CHART 3)
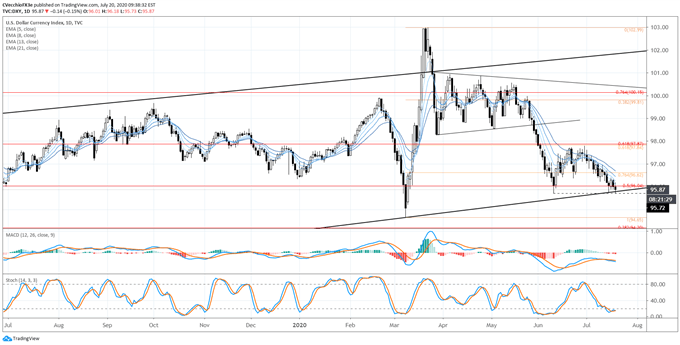
The DXY Index’s performance in the first half of July has proved sheepish at best, with seven of the ten trading days (and seven of the past nine overall) producing downside losses. This represents follow-through from the doji candles and inverted hammers forming against the June 22 bearish key reversal, in hindsight evidence of price action topping out. Failure at not only the 61.8% retracement (97.84) of the 2020 low/high range, but the 61.8% retracement (97.87) of the 2017 high/2018 low range as well, proved to be bad omens.
Bearish momentum has accelerated, with the DXY Index fully below the daily 5-, 8-, 13-, and 21-EMA envelope, which is still in bearish sequential order. Daily MACD has turned lower in bearish territory, while Slow Stochastics have dropped into overbought territory. More losses cannot be ruled out in the near-term.
IG Client Sentiment Index: EUR/USD RATE Forecast (July 20, 2020) (Chart 4)
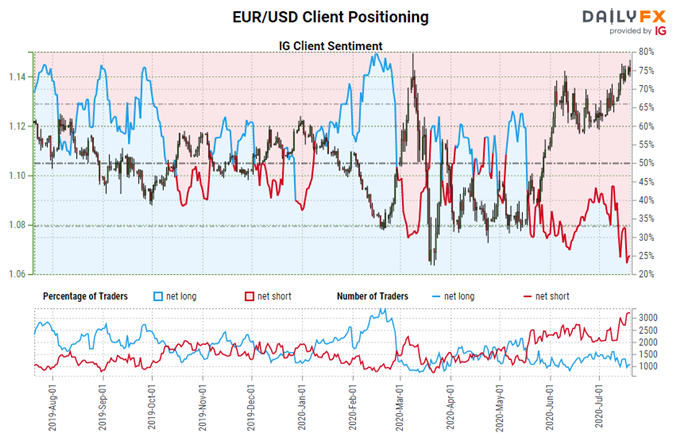
EUR/USD: Retail trader data shows 30.78% of traders are net-long with the ratio of traders short to long at 2.25 to 1. The number of traders net-long is 24.55% higher than yesterday and 7.06% lower from last week, while the number of traders net-short is 4.20% lower than yesterday and 31.27% higher from last week.
We typically take a contrarian view to crowd sentiment, and the fact traders are net-short suggests EUR/USD prices may continue to rise.
Positioning is less net-short than yesterday but more net-short from last week. The combination of current sentiment and recent changes gives us a further mixed EUR/USD trading bias.

Recommended by Christopher Vecchio, CFA
Traits of Successful Traders
— Written by Christopher Vecchio, CFA, Senior Currency Strategist
|
|
Leave a Reply
You must be logged in to post a comment.