

US Dollar Outlook:
Advertisement
Despite robust US economic data, risk sentiment has continued to weigh on the safe-haven Dollar, fueling the demand for Emerging Market currencies which has allowed USD/ZAR bears to drive prices below critical support. With inflationary concerns and declining US Treasury Yields at the forefront of the recent pullback, the release of the Michigan Consumer Sentiment could potentially assist in the catalyzation of short-term price action for both the Rand and the Swiss Franc, providing a glimmer of hope for USD bulls.

DailyFX Economic Calendar

Recommended by Tammy Da Costa
How do news events affect your trade?
USD/ZAR Technical Analysis
For most of this year, USD/ZAR has been trading within a well-defined range between the key psychological levels of 14.50 and 15.00. However, as risk appetite continues to favor Emerging Market (EM) currencies, the volatile Rand has overcome a major hurdle by breaking below critical support, formed by the lower bound of the descending triangle. Although the sustainably of the downward trajectory remains questionable, bears remain the dominant force of the immediate move as prices continue to trade below both the 50 and 200-period MA.
As bears strive to break below the next support level of 14.00, risk sentiment remains the primary catalyst for the short-term move. However, failure to clear the 14.00 barrier could see bulls retaliating, driving prices back towards 14.50, a former hinderance for bearish progression.

Recommended by Tammy Da Costa
Discover the importance of risk management
USD/ZAR Daily Chart

Chart prepared by Tammy Da Costa, IG
USD/CHF Technical Analysis
USD/CHF continues to test key Fibonacci support after bulls failed to gain traction above trendline resistance, holding firm just below the key psychological level of 0.95. Although the downward trajectory has remained intact since 2019, bearish momentum subsided in early January as the greenback recovered from its 2020 slide.
With the formation of a golden cross supporting the upward move, recent MACD divergence suggested that the USD rally was beginning to lose steam, allowing Swiss Franc enthusiasts to regain control of the systemic, prominent trend.
USD/CHF Daily Chart
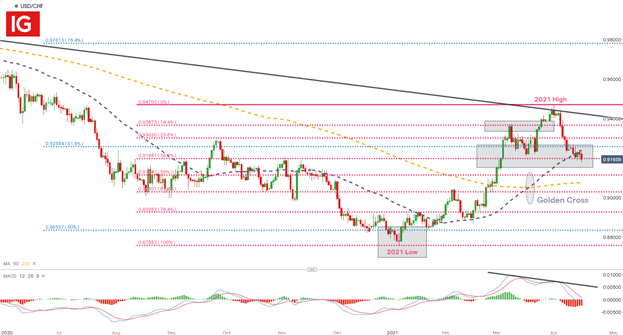
Chart prepared by Tammy Da Costa, IG
However, after a steep decline, price action has temporarily stalled between the confines of key Fibonacci levels of both the long and short-term major moves, forming a zone of confluency between 0.919 (the 38.2% retracement of the 2021 move) and 0.925 (50% retracement of the historical move) which continues to hold as support and resistance for the imminent move.
| Change in | Longs | Shorts | OI |
| Daily | -4% | 0% | -3% |
| Weekly | 4% | 28% | 10% |
— Written by Tammy Da Costa, Market Writer for DailyFX.com
Contact and follow Tammy on Twitter: @Tams707
https://www.dailyfx.com/chf?ref-author=dacosta
|
|
Leave a Reply
You must be logged in to post a comment.