

USD PRICE OUTLOOK: US DOLLAR AIMING HIGHER INTO MONTH END BUT GIVES BACK SOME GAINS AFTER 2Q GDP REPORT
- USD price action on the offensive headed into month-end but fading after US GDP data
- 2Q US GDP report printed a jaw-dropping 32.9% collapse in economic activity
- US Dollar is down over 4% for July and the recent bearish trend may continue
The broader US Dollar has declined well over 4% throughout July judging by performance of the DXY Index, but the popular basket of major currency pairs was attempting to claw back some downside early during Thursday’s trading session with month-end upon us. A short-lived relief bounce in the Greenback looks like it is reverting back lower as USD price action reacts negatively to 2Q-2020 US GDP data that just crossed the wires.

Recommended by Rich Dvorak
Introduction to Forex News Trading
2Q-2020 US GDP REPORT PRINTS HISTORIC COLLAPSE IN ECONOMIC ACTIVITY DUE TO COVID-19

Chart Source: DailyFX Economic Calendar
Amid the coronavirus lockdown that paralyzed the global economy for several weeks during the second quarter, the United States just reported a 32.9% contraction in quarterly GDP growth, though the staggering collapse was largely expected.
EUR/USD PRICE CHART: 1-MINUTE TIME FRAME (30 JULY 2020 INTRADAY)
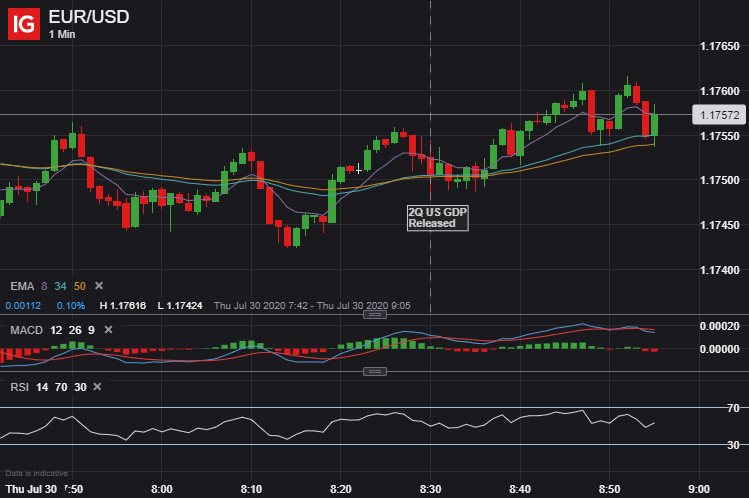
EUR/USD price action has slid since piercing the 1.1800-price level in the wake of yesterday’s FOMC decision. That said, spot EUR/USD just turned positive on the day following the release of US GDP data and may look to continue its recent bullish trend as US Dollar weakness lingers.
| Change in | Longs | Shorts | OI |
| Daily | -4% | -2% | -2% |
| Weekly | 11% | 2% | 5% |
GBP/USD PRICE CHART: 1-MINUTE TIME FRAME (30 JULY 2020 INTRADAY)

GBP/USD price action had a similar response to 2Q US GDP data with the Pound-Dollar advancing immediately after the report. The cable is now trading near session highs with US Dollar downside most notable against its Pound Sterling peer.
| Change in | Longs | Shorts | OI |
| Daily | -13% | 0% | -5% |
| Weekly | -11% | 9% | 1% |
USD/JPY PRICE CHART: 1-MINUTE TIME FRAME (30 JULY 2020 INTRADAY)
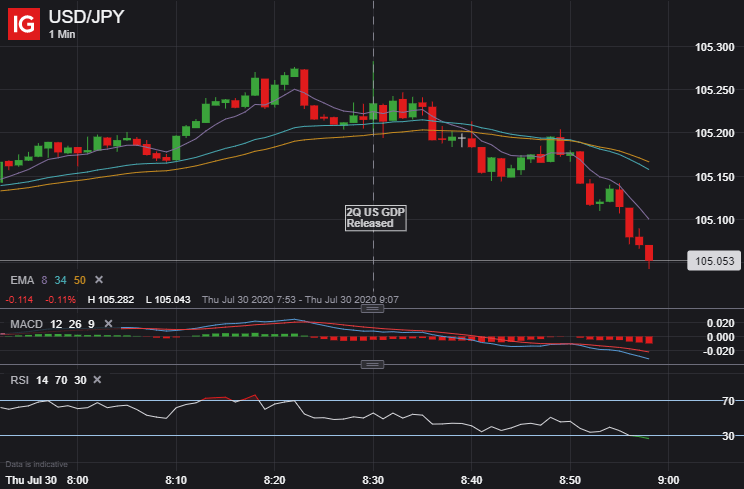
Likewise, the Dollar-Yen slipped to intraday lows as market participants digested US GDP data for 2Q-2020. Spot USD/JPY price action nevertheless trades modestly higher on balance for Thursday at the time of writing. In addition to traders’ reactions to yesterday’s FOMC statement and today’s GDP data likely weighing on the US Dollar, month-end rebalancing could be another factor as well as S&P 500 earnings and fiscal stimulus talks.
Keep Reading: US Dollar Paces Big Drop for July as Consumer Confidence Wanes
— Written by Rich Dvorak, Analyst for DailyFX.com
Connect with @RichDvorakFX on Twitter for real-time market insight
|
|
Leave a Reply
You must be logged in to post a comment.