

Dow Jones, S&P 500, Nasdaq 100 Outlook:
Equities Remain Under Pressure
After a grueling week for US equity indices, bulls were unable to maintain the uptrend which has persisted despite the looming global economic crunch. After the Nasdaq and S&P 500 reached all-time highs in the beginning of September, the much anticipated pullback soon came into play, resulting in two consecutive weeks of losses. From a historical perspective, September is known to produce high volatility and with that being said, for the duration of the month, price action may be of particular interest as the US Presidential Election nears.
Fundamentals will also likely play a role as both uncertainty regarding further stimulus measures and the upcoming elections are additional factors to consider.
Visit the DailyFX Educational Center to discover why news events are Key to Forex Fundamental Analysis
Nasdaq 100 Technical Analysis
This week, tech stocks plummeted; resulting in a pullback to a key level of support, formed by the 50% retracement of the June low to the September high. This comes after the occurrence of a MACD crossover from above the zero-line on 3 September, indicating that the trend could reverse in the short-term.
Starts in:
Live now:
Sep 13
( 22:09 GMT )

Join James Stanley’s Price Action Webinar
Key News Trading Events for the Week Ahead
NASDAQ 100 Daily Chart
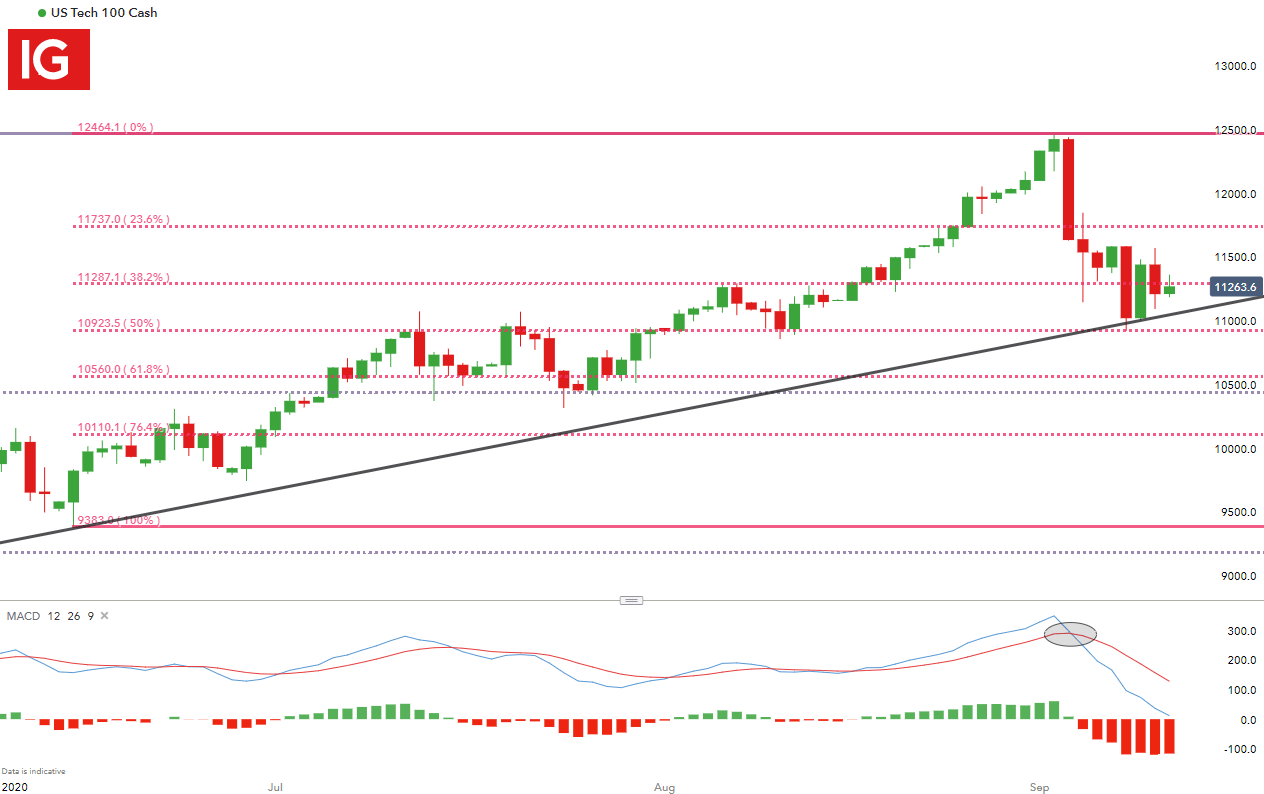
Chart prepared by Tammy Da Costa, IG
Meanwhile, the 50% retracement level, combined with the psychological level of 11000 kept bears at bay, highlighting that bullish continuation could not yet be ruled out, with the 38.2% retracement level helping to hold as resistance at 11287.1. A break above this level may see price action gain further momentum, with the psychological level of 11500 being a next level of interest. However, if bears push through 11000, a possible reversal towards the downside could look more likely.
S&P 500 Technical Analysis
Following in Nasdaq’s footprints, the S&P 500 also experienced its second consecutive week of losses, driving price action into a confluent zone, between the 23.6 and 38.2% Fibonacci levels. Currently, the Stochastic indicator on the Daily chart is hovering around 20, indicating that the index may be entering or nearing oversold territory.
If bears are able to break below 3339.35, the 38.2% Fibonacci level, further downside may show with the psychological level of 3300 offering additional support potential. On the flip side, the 23.6% retracement level continues to hold as resistance at 3435.57.
Starts in:
Live now:
Sep 16
( 16:09 GMT )

Join Day 2 of the DailyFX Summit discussing indices
DailyFX Education Summit: Trade Your Market – Day 2, Indices
S&P 500 Daily Chart
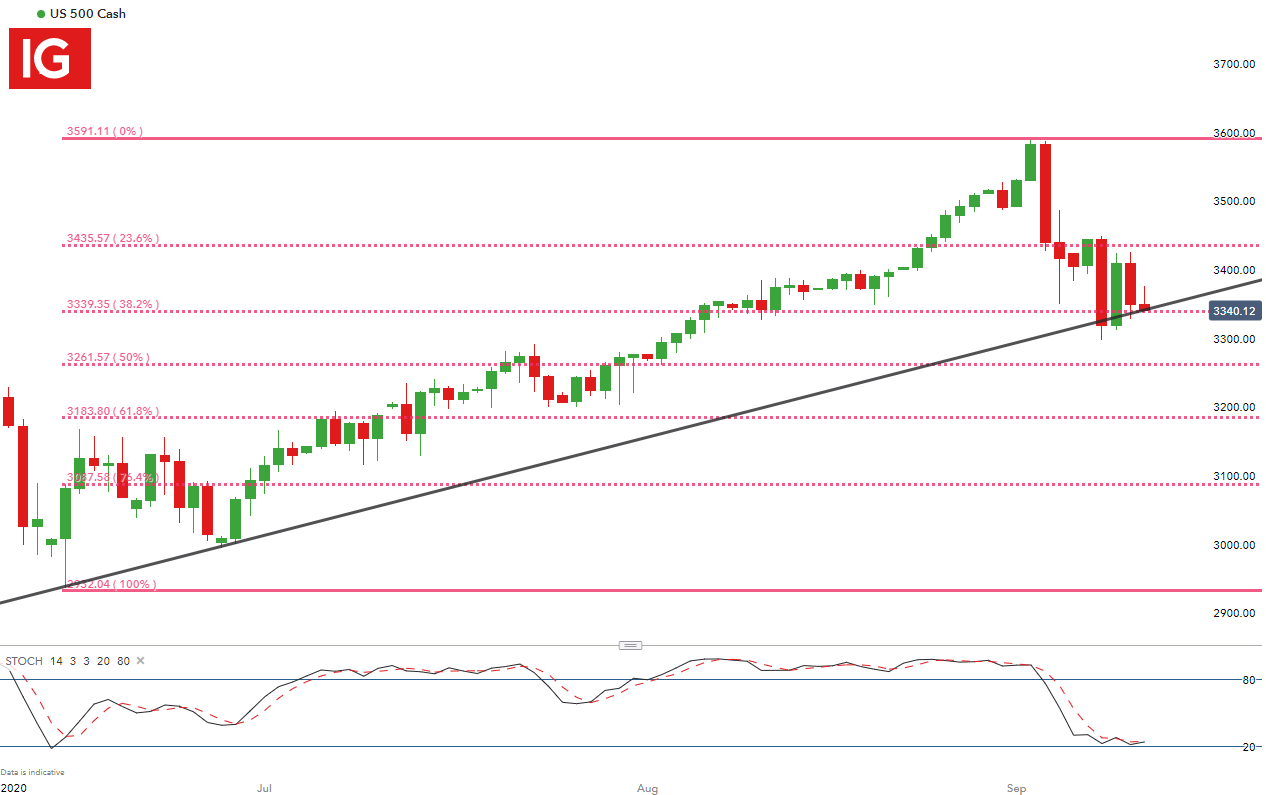
Chart prepared by Tammy Da Costa, IG
Dow Jones Index Technical Analysis
After reaching its peak in February, the Dow Jones Index plummeted as the coronavirus pandemic created panic throughout the markets. However, since then, a strong bullish trend prevailed allowing the index to drive towards the psychological level of 2900.
Now, as prices have started to retrace, currently hovering around 28000, bulls and bears are eyeing psychological levels on either side, but for now, price action continues to remain above the trendline.
Dow Jones Index Daily Chart

Chart prepared by Tammy Da Costa, IG
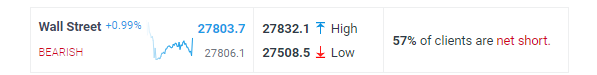
At the time of writing, IGCS indicates that bears are dominating the market, with 56% of retail traders holding short positions in the Dow. Although we typically take a contrarian view to crowd sentiment, current market conditions may see prices continuing to fall considering recent changes to the IGCS indicator.

Recommended by Tammy Da Costa
How does sentiment affect the market?
— Written by Tammy Da Costa, Market Writer for DailyFX.com
Contact and follow Tammy on Twitter: @Tams707
|
|
Leave a Reply
You must be logged in to post a comment.