

CANADIAN DOLLAR OUTLOOK: USD/CAD PRICE ACTION PIVOTS LOWER AFTER CLASHING WITH 100-DAY MOVING AVERAGE
- USD/CAD price reverses lower as the US Dollar surrenders recent gains back to the Loonie
- Canadian Dollar bulls stood their ground near the 1.3400-level and 100-day moving average
- A recovery in market sentiment seems to have given pause to this month’s rally by USD/CAD
USD/CAD price action is coming back under pressure and brings to light a notable intraday reversal by the US Dollar. Spot USD/CAD was pushing higher with the broader US Dollar Index during early Thursday trade, but shortly after the opening bell on Wall Street, markets made a strong effort to stabilize the selloff across risk assets.

Recommended by Rich Dvorak
Trading Forex News: The Strategy
The clear improvement in trader sentiment after S&P 500 bears failed to take out major support was echoed by a pullback in the US Dollar. The US Dollar generally strengthens during episodes of risk aversion and typically weakens when appetite for risk is flush. This is because the USD is largely viewed as a top safe-haven currency.
USD/CAD PRICE CHART: 4-HOUR TIME FRAME (31 AUGUST TO 24 SEPTEMBER 2020)
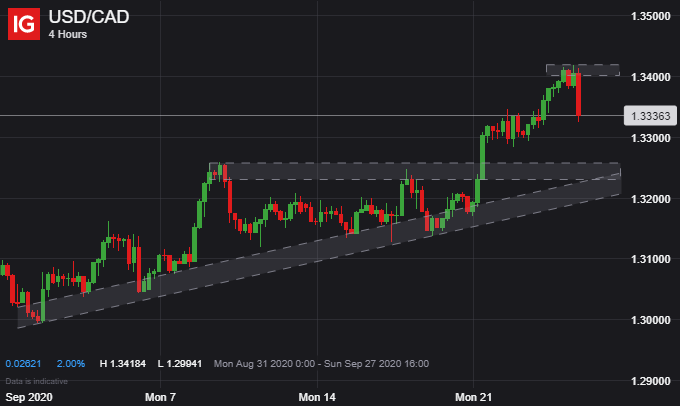
Chart by @RichDvorakFX
USD/CAD price action led the midday reversal lower by the broader US Dollar following a rejection of the 1.3400-handle. This technical resistance level hanging overhead USD/CAD is roughly highlighted by the 100-day moving average and 38.2% Fibonacci retracement of the bearish leg recorded from May through August.

Recommended by Rich Dvorak
Traits of Successful Traders
Downward pressure on USD/CAD has accelerated since US Dollar bulls failed to take out this big technical barrier. That said, spot prices have so far held the prior session lows and could look to the 1.3300-handle underpinned by lows printed earlier this week. Breaching this potential area of buoyancy could encourage USD/CAD bears to make a push toward resistance-turned-support noted by the 08 September and 16 September swing highs.
USD/CAD PRICE CHART: DAILY TIME FRAME (08 MAY TO 24 SEPTEMBER 2020)
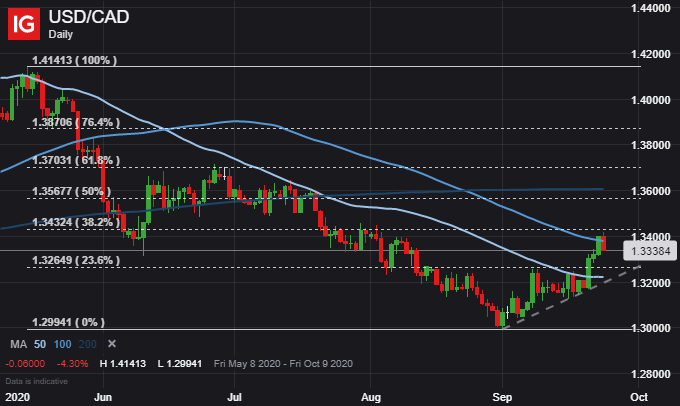
Chart by @RichDvorakFX
A back-test of the 50-day moving average slightly above 1.3200 is another potential support zone that could see an influx of demand for USD/CAD. As such, the major currency pair peeling back today could simply chalk up to be a healthy pause in the short-term bullish trend connecting the string of higher lows this month. The US Dollar has been ripping higher throughout September as markets swoon amid resurgent volatility, and this is a potentially bullish USD/CAD theme that looks likely to linger.
| Change in | Longs | Shorts | OI |
| Daily | -16% | 18% | -6% |
| Weekly | -24% | 24% | -11% |
Keep Reading: US Dollar Extends Rally as Global PMI Data Fans Volatility
— Written by Rich Dvorak, Analyst for DailyFX.com
Connect with @RichDvorakFX on Twitter for real-time market insight
|
|
Leave a Reply
You must be logged in to post a comment.