

Japanese Yen Talking Points
USD/JPY trades to a fresh weekly high (110.17) as longer-dated US Treasury yields recover ahead of the Federal Reserve interest rate decision, and fresh projections coming out of the central bank are likely to sway the exchange rate as Fed officials are slated to update the Summary of Economic Projections (SEP).
Advertisement
USD/JPY Eyes June High Ahead of FOMC amid Recovery in US Yields
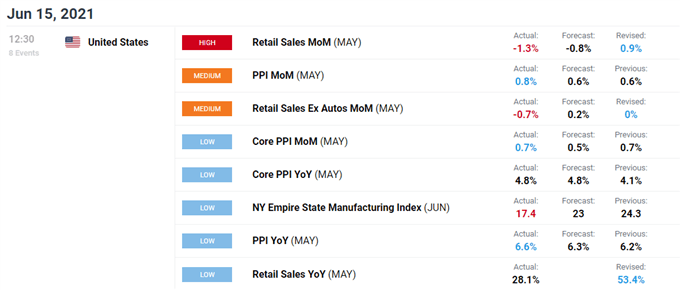
USD/JPYapproaches the monthly high (110.33) despite a larger-than-expected decline in US Retail Sales as the Producer Price Index (PPI) climbs 6.6% per annum in May to mark the highest reading since the data series began in 2010.
It remains to be seen if the Federal Open Market Committee (FOMC) will respond to the mixed data prints as the central bank braces for a transitory rise in inflation, and more of the same from Chairman Jerome Powell and Co. may undermine the recent advance in USD/JPY as the Fed remains “committed to using its full range of tools to support the U.S. economy in this challenging time.”
At the same time, an upward revision in the Fed’s economic projections may prop up USD/JPY as “a number of participants suggested that if the economy continued to make rapid progress toward the Committee’s goals, it might be appropriate at some point in upcoming meetings to begin discussing a plan for adjusting the pace of asset purchases,” but the recent appreciation in the exchange rate has triggered a shift in retail sentiment like the behavior seen earlier this year.

The IG Client Sentiment shows 45.74% of traders are currently net-long USD/JPY, with the ratio of traders short to long standing at 1.19 to 1.
The number of traders net-long is 5.15% lower than yesterday and 21.87% lower from last week, while the number of traders net-short is 27.82% higher than yesterday and 32.07% higher from last week. The decline in net-long position could be a function of profit taking behavior as USD/JPY trades to a fresh weekly high (110.17) ahead of the Fed rate decision, while the rise in net-short interest has fueled the shift in retail sentiment as 52.39% of traders were net-long the pair earlier this month.
With that said, the recent shift in retail sentiment may coincide with a further appreciation in USD/JPY like the behavior seen earlier this year, and the decline from the March high (110.97) may turn out to be a correction rather than a change in trend as the 10-Year US Treasury yield extends the rebound from the monthly low (1.43%).
USD/JPY Rate Daily Chart
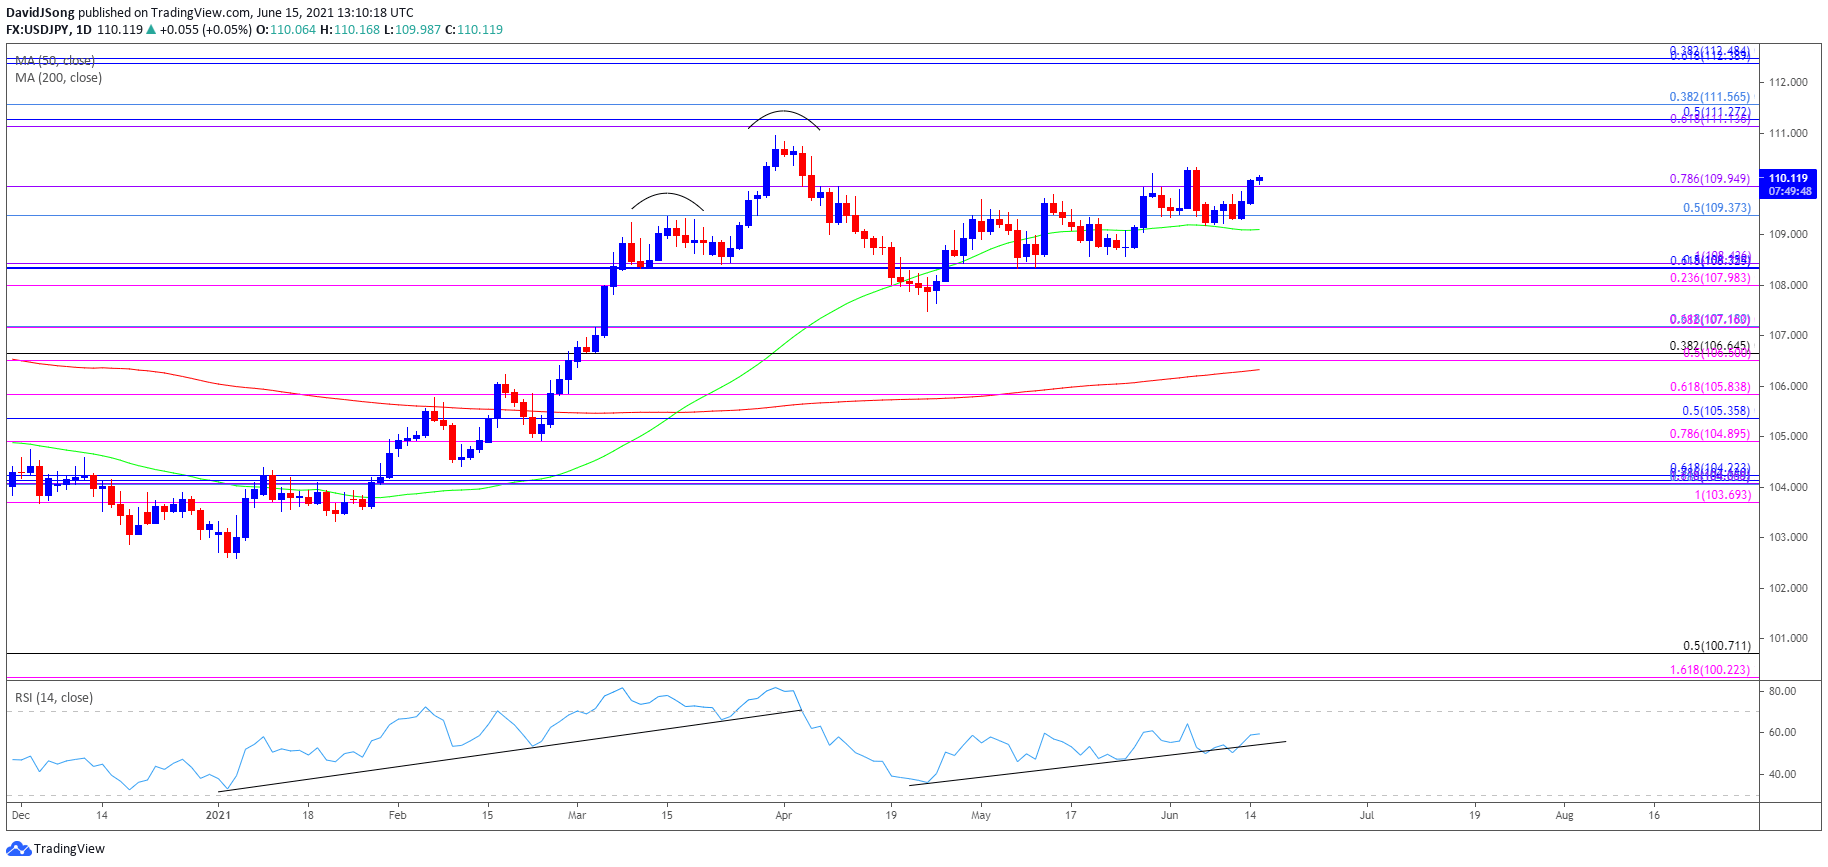
Source: Trading View
- USD/JPY approached pre-pandemic levels as a ‘golden cross’ materialized in March, with a bull flag formation unfolding during the same period as the exchange rate traded to a fresh yearly high (110.97).
- The Relative Strength Index (RSI) showed a similar dynamic as the indicator climbed above 70 for the first time since February 2020, but the pullback from overbought territory has negated the upward trend from this year, which pushed USD/JPY below the 50-Day SMA (109.10) for the first time since January
- Nevertheless, USD/JPY reversed ahead of the March low (106.37) to largely negate the threat of a head-and shoulders formation, with the exchange rate breaking above the left shoulder in May.
- Since then, USD/JPY has climbed back above the 50-Day SMA (109.10) to take out the May high (110.20), with the break/close above the close above the Fibonacci overlap around 109.40 (50% retracement) to 110.00 (78.6% expansion) opening up the March high (110.97).
- Next area of interest comes in around 111.10 (61.8% expansion) to 111.60 (38.2% retracement) followed by the overlap around 112.40 (61.8% retracement) to 112.80 (38.2% expansion).
- However, USD/JPY may threaten the opening range for June if it struggles to hold above the Fibonacci overlap around 109.40 (50% retracement) to 110.00 (78.6% expansion), with a move below the 50-Day SMA (109.17) opening up the 108.00 (23.6% expansion) to 108.40 (100% expansion) region.
— Written by David Song, Currency Strategist
Follow me on Twitter at @DavidJSong
|
|
Leave a Reply
You must be logged in to post a comment.