

USD/JPY Analysis:
- Japan experienced its largest quarterly decline in GDP on record establishing third straight quarter of negative growth
- The Commitment of Traders (CoT) Report reveals a slight long bias amongst hedge funds/speculators despite a softer dollar
- USD/JPY intraday price action currently at crucial area of confluence as the short term uptrend faces potential threat
Why is GDP Data So Important? – A Guide to GDP Data and Forex Trading
Largest Recorded Decline in Japanese GDP
Japanese GDP came in at -7.8%, slightly worse than the expected figure of -7.6% as Q2 was officially the worst quarterly contraction on record. While there isn’t a single major economy that has been shielded from the economic hardships inflicted by the coronavirus pandemic, the world’s third largest economy has been particularly hard hit as shopping malls stood empty while international demand for motor vehicles, a major Japanese export, dropped significantly.

For all market-moving data releases and events see the DailyFX Economic Calendar
For perspective, when comparing the annualized figures, the record drop (-27.8%) is not as bad as that experienced in the US (-32.9%) but remains higher than the Japanese Q1 2009 figure of -17.8% during the global financial crisis.
Commitment of Traders (CoT) Data Reveals Slight Net-Long Positioning
CoT data shows that major hedge funds, also known as the “smart money”, currently hold more long Japanese Yen contracts as opposed to short contracts as there has been a steady decline in shorts (blue) over the last 12 months with longs (orange) remaining pretty flat. We typically witness positions that are reflective of the trend in this data as opposed to client sentiment data which usually counters trends.
Non-commercial Positioning, USD/JPY (inverted)

Source: Refinitiv, DailyFX
Read our in-depth guide on using the CoT report in forex trading
See Justin McQueen’s article for a full report on the most recent CoT data
USD/JPY Key Intraday Technical Levels
Price action immediately after the Japanese GDP data release was largely contained even though the figure missed expectations.
Currently, trading continues around an area of confluence (on the 4-hour chart) where trendline support coincides with the short term low around 106.45. The bullish trend remains intact should price close above the short term trendline. Thereafter, initial resistance appears at the recent swing high and should bullish momentum continue, 107.05 presents the next resistance zone.
However a break and close below trendline support and possibly even a break below short-term support may bring the 106.20 level into focus. Further bearish momentum would then see the 106.00 psychological level as the next level of support.
USD/JPY 4-Hour Chart: Trendline Support Coinciding with Short-Term Low
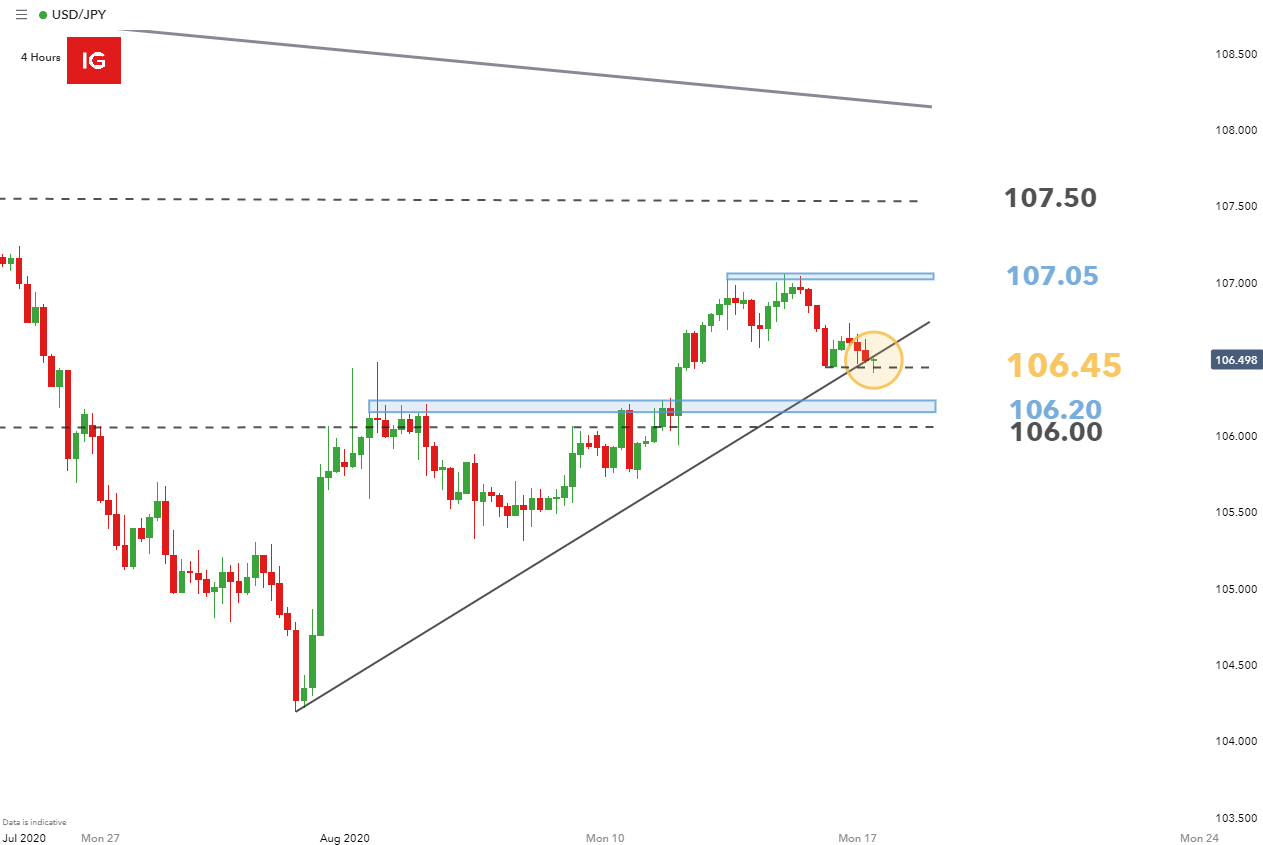
Chart prepared by Richard Snow, IG
Resources used in this analysis:

Recommended by Richard Snow
Where is JPY likely headed? Read quarterly forecast
— Written by Richard Snow for DailyFX.com
Contact and follow Richard on Twitter: @RichardSnowFX
|
|
Leave a Reply
You must be logged in to post a comment.