Japanese Yen Talking Points
USD/JPY is on track to mark a three-day decline even as the 10-Year US Treasury yield climbs to a fresh monthly high (1.71%), and the exchange rate may face a larger pullback over the remainder of the month as the Relative Strength Index (RSI) offers a textbook sell signal.
USD/JPY Rate on Track for Three-Day Decline as RSI Sell Signal Emerges
USD/JPY trades to a fresh weekly low (113.62) as a growing number of Federal Reserve officials warn of a weaker-than-expected recovery, and the exchange rate may continue to consolidate during the Fed’s blackout period as the central bank looks to gradually scale back monetary support.
During a speech at 2021 Milken Institute Global Conference, Fed Governor Randal Quarles acknowledged that “growth in the third quarter is likely to be lower than we had expected,” with the official going onto say that “supply bottlenecks and labor shortages that have been more widespread and persistent than many expected.”
However, Governor Quarles insists that these developments “have for the most part simply postponed activity temporarily and that robust growth will return in the coming months,” and the comments suggest the Federal Open Market Committee (FOMC) will stay on track to scale back monetary support as the official remains “quite optimistic about the capacity and willingness of consumers and businesses to power a robust expansion.”
As a result, it seems as though FOMC will stick to its exit strategy as Governor Quarles “would support a decision at our November meeting to start reducing these purchases and complete that process by the middle of next year,” and the deviating paths between the Fed and Bank of Japan (BoJ) may keep USD/JPY afloat as longer-dated US yields continue to retrace the decline from earlier this year.
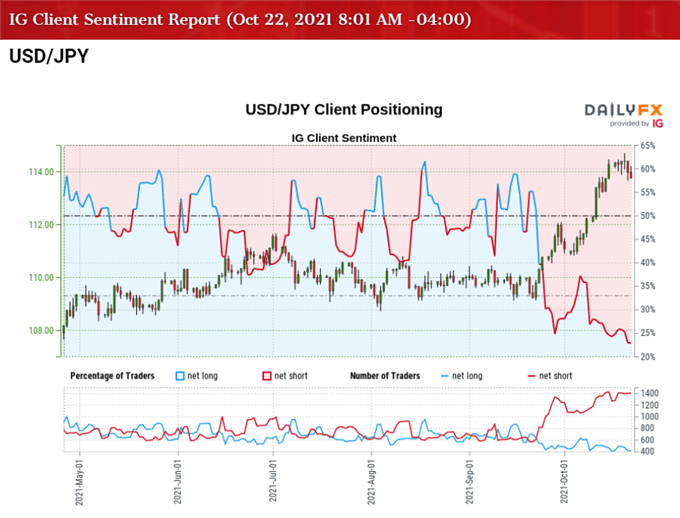
Nevertheless, recent price action raises the scope for a larger pullback in USD/JPY as the Relative Strength Index (RSI) falls back from overbought territory to offer a textbook sell signal, but the tilt in retail sentiment looks poised to persist as the exchange rate extends the bullish trend from earlier this year.
The IG Sentiment Client report shows only 23.07% of traders are currently net-long USD/JPY, with the ratio of traders short to long standing at 3.33 to 1.
The number of traders net-long is 4.15% lower than yesterday and 7.97% lower from last week, while the number of traders net-short is 2.52% higher than yesterday and 15.09% higher from last week. The decline in net-long interest comes as USD/JPY marks the first three-day decline since August, while the rise in net-short position comes as the RSI offers a textbook signal.
With that said, USD/JPY may exhibit a bullish trend throughout the remainder of the year amid the ongoing recovery in longer-dated Treasury yields, but the exchange rate may face a larger correction ahead of the next Fed rate decision on November 3 as the exchange rate extends the series of lower highs and lows from earlier this week.
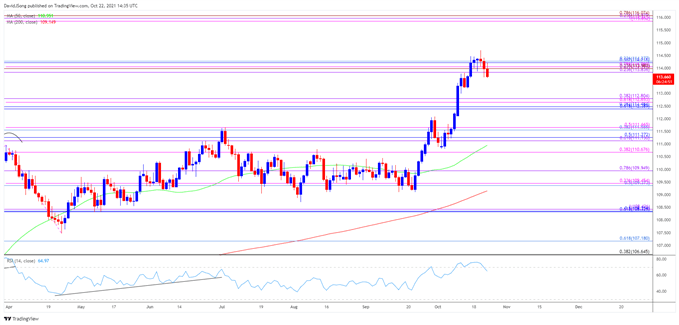
USD/JPY Rate Daily Chart
Source: Trading View
- The broader outlook for USD/JPY remains constructive as it trades to fresh yearly highs in the second half of 2021, with the 200-Day SMA (109.15) indicating a similar dynamic as it retains the positive slope from earlier this year.
- The Relative Strength Index (RSI) showed a similar dynamic as it pushed into overbought territory for the first time since the first quarter of 2021, but recent developments warn of a larger pullback in USD/JPY as the oscillator falls back from overbought territory to offer a textbook sell signal.
- In turn, USD/JPY appears to have reversed course ahead of the November 2017 high (114.74), with lack of momentum to hold above the Fibonacci overlap around 113.80 (23.6% expansion) to 114.30 (23.6% retracement) bringing the 112.40 (61.8% retracement) to 112.80 (38.2% expansion) region back on the radar.
- Next area of interest comes in around 111.10 (61.8% expansion) to 111.60 (38.2% retracement), with a move below the 50-Day SMA (110.95) opening up the 109.40 (50% retracement) to 110.00 (38.2% expansion) region.
— Written by David Song, Currency Strategist
Follow me on Twitter at @DavidJSong
|
|


Leave a Reply
You must be logged in to post a comment.